For ProductWhere the funnel breaks,
Where the funnel breaks,
and who never entered it.
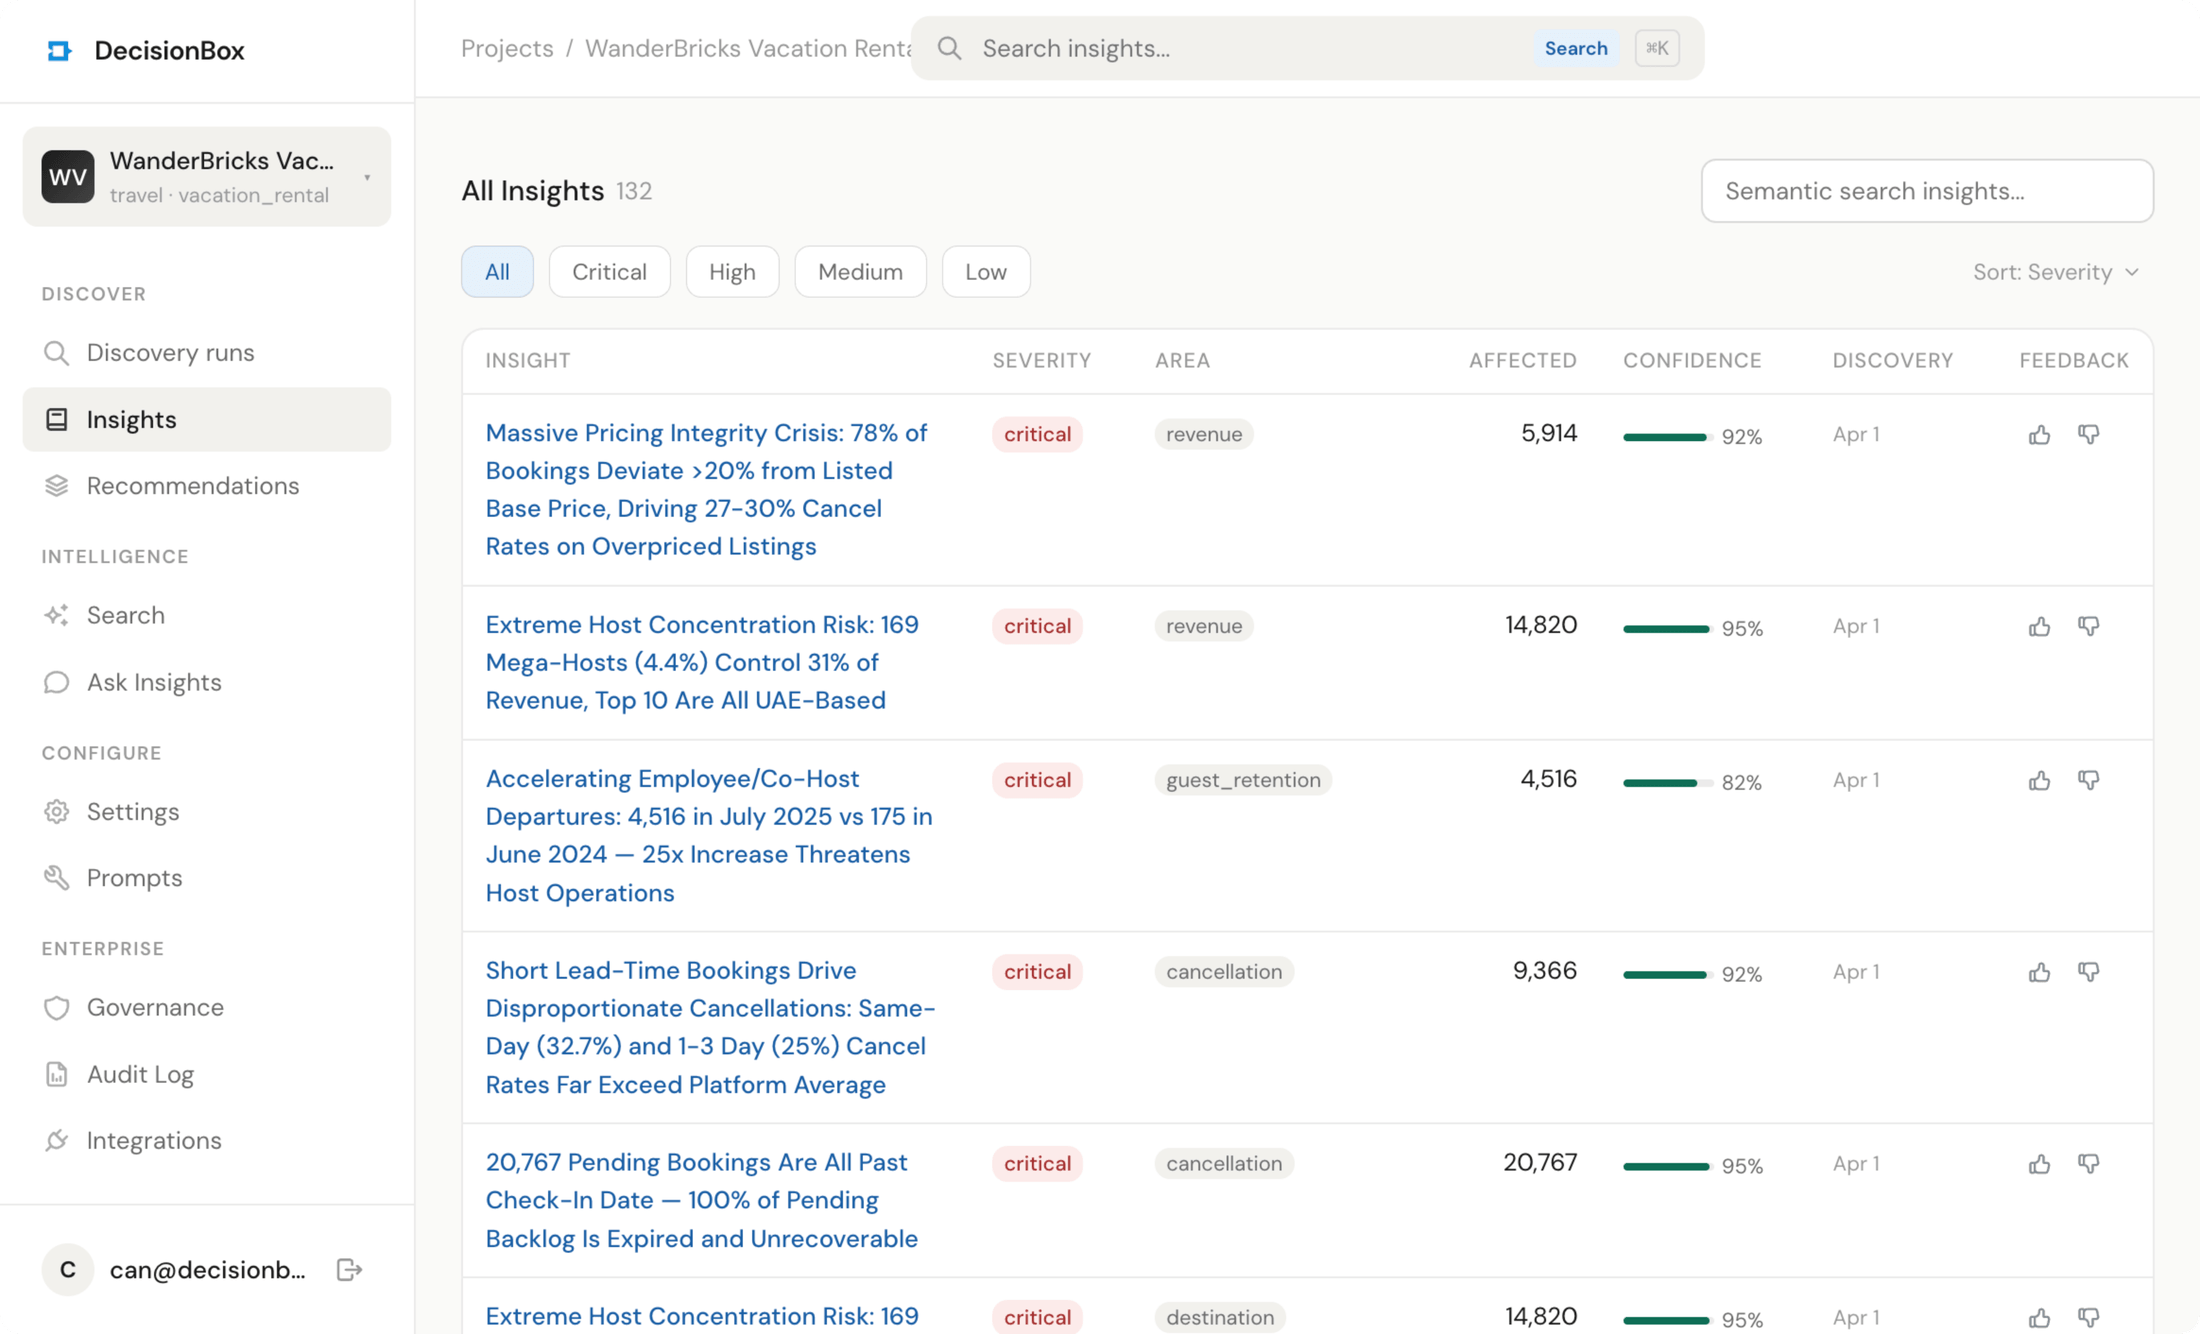
Product events sit in your warehouse. You only ever pull the top-line DAU chart. DecisionBox walks the funnel, the segment cuts, and the behavior sequences nobody has time to build — and tells you which step, for which cohort, is actually costing you the user.
CRITICALActivation failure
80% of registered hosts never create a single listing — the onboarding funnel never recovers past step one
14,273 of 17,852 hosts · zero listings
Vacation-rental platform · all-time registrations
What it answers
Five questions your dashboards don't
01
How many of our registered users never made it past step one?
Activation rate we track. The silent majority that never activated at all, we never count. The agent does.
02
At which step does each acquisition channel’s users actually drop — and where are those drops different from the average?
Funnels by channel, side by side. Shows where each surface leaks, not a blended average.
03
Is our re-engagement number growing because the product got better, or because we keep replacing the users we already lost?
Holdout cohorts across acquisition windows. Incremental re-engagement, not "we sent more emails."
04
What share of sessions are hitting a UX frequency cap we never set?
Counts per-session events — offers, prompts, modals — across segments. Surfaces the overload your team is running blind to.
05
Which first-48-hour behavior predicts a return at day 30 — and how many sessions does the non-returning cohort even have?
Sequence analysis at cohort level. The predictive behavior is rarely the one on your PRD.
From real runs
From a pattern to a playbook
Every finding the agent produces comes paired with a recommendation — a target segment, an expected impact, a concrete set of actions. Three real pairs below, pinned as the agent surfaced them.
CRITICALThreshold effect
Review scores hold at 4.27 through day 6 of ship time — then cliff to 2.95, then 1.81 by day 10. A boundary, not a gradient
Cliff at day 6 · 4.27 → 1.81
Marketplace · 11,123 orders
enforce the boundary →
P1Recommendation
Seller SLA
Enforce a 5-day ship-time SLA cap; place 51 sellers averaging 7+ days on performance improvement plans with auto-throttle
Expected impact
+0.08–0.15 marketplace-wide review score
Target: 120 sellers (51 critical)5 concrete actions
HIGHUX overload
Active users see an average of 17.5 pop-up offers per session. Session flow is visibly fractured — the more offers shown, the less of the session actually happens
17.5 offers/session · 1,637 users
Casual mobile game · 30-day window
P1 · one sprint
P1Recommendation
Session cap
Hard-cap rewarded-ad and booster offers to 3 per session
Expected impact
+10–15% conversion
Target: 20,110 users4 concrete actions
HIGHRetention cohort
Players who complete a first session average only 3.8 sessions per month. The majority never see the product a second time at any depth
3.8 sessions/month · 6,209 total from 1,637 users
Casual mobile game · 30-day window
first-week playbook ~
P2Recommendation
Retention loop
Launch a high-value 7-day welcome calendar that pops on the first session of each day
Expected impact
+50–80% engagement in first week
Target: 1,698 new players4 concrete actions
Every pair above is from a real DecisionBox run. Source datasets are anonymized for the public site.
The honest list
What it does, and what it doesn't
What it does
- Walks event sequences at cohort and segment level — not top-line retention.
- Works with the event taxonomy already in the warehouse.
- Surfaces silent issues: cohorts quietly under-performing, activation steps that regress.
What it doesn't
- Do session replay or per-user debugging. Cohort and segment level only.
- Fix a broken event taxonomy. Garbage events produce garbage findings.
- Write to Amplitude, Mixpanel, or your analytics UI. Findings live in DecisionBox.
app.decisionbox.io/insights
Keep reading