How We Found $5.8M in Hidden Revenue Leakage Using AI-Powered Data Discovery on Databricks

DecisionBox autonomously analyzed 11 tables, executed 233 SQL queries, and surfaced 67 validated insights in 76 minutes — no dashboards to build, no SQL to write.
TL;DR
We pointed DecisionBox at a Databricks SQL Warehouse connected to a vacation rental dataset (WanderBricks — 11 tables, 500K+ rows) and hit Run Discovery. Seventy-six minutes later, the AI agent had:
- Explored every table autonomously, writing and executing 92 SQL queries during exploration alone
- Identified 67 insights across 7 analysis areas — 17 critical, 18 high severity
- Validated each claim with independent SQL queries — 21 confirmed exactly, 12 adjusted with corrected numbers
- Discovered a $5.8M revenue leak from cancellations, a 28.8% cancellation spike driven by same-day bookings, and an 80% host onboarding failure rate
No one told it what to look for. No one wrote a single query. The agent figured it all out.
The Setup: Databricks + DecisionBox in 5 Minutes
DecisionBox connects directly to your Databricks SQL Warehouse. The setup is three fields:
| Setting | Value |
|---|---|
| Host | dbc-xxxxx.cloud.databricks.com |
| HTTP Path | /sql/1.0/warehouses/xxxxx |
| Auth | Personal Access Token |
We pointed it at the samples.wanderbricks schema — a vacation rental marketplace dataset with 11 tables covering users, hosts, properties, destinations, bookings, payments, reviews, clickstream, page views, support logs, and booking updates.
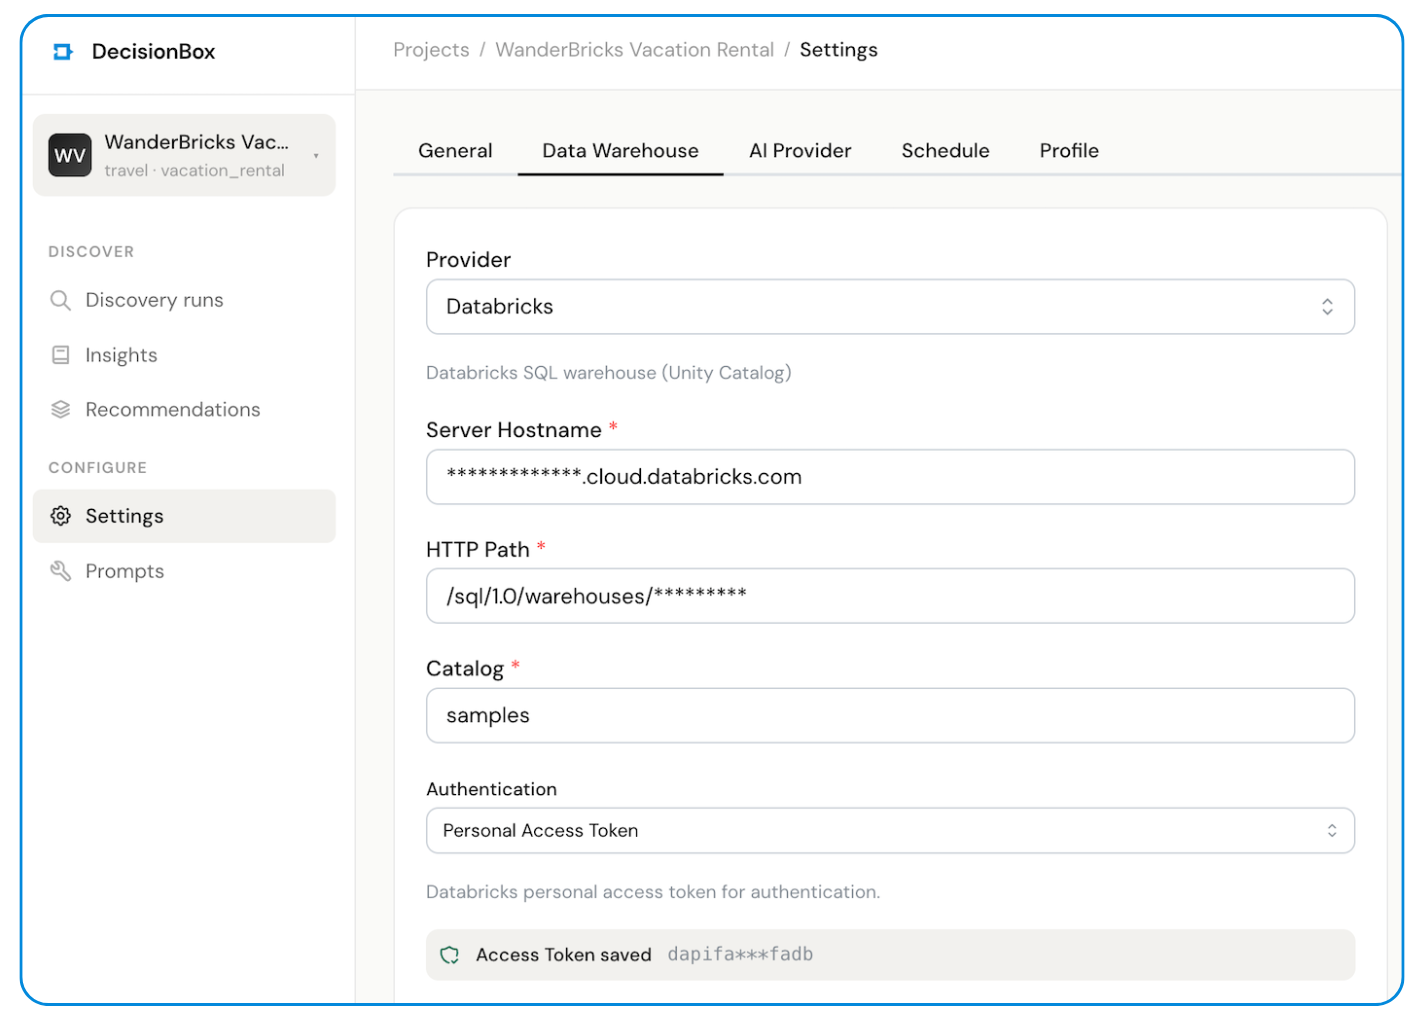
Then we configured the AI model (Claude Opus via Vertex AI) and hit Run Discovery.
That's it. No metric definitions. No dashboard templates. No SQL.
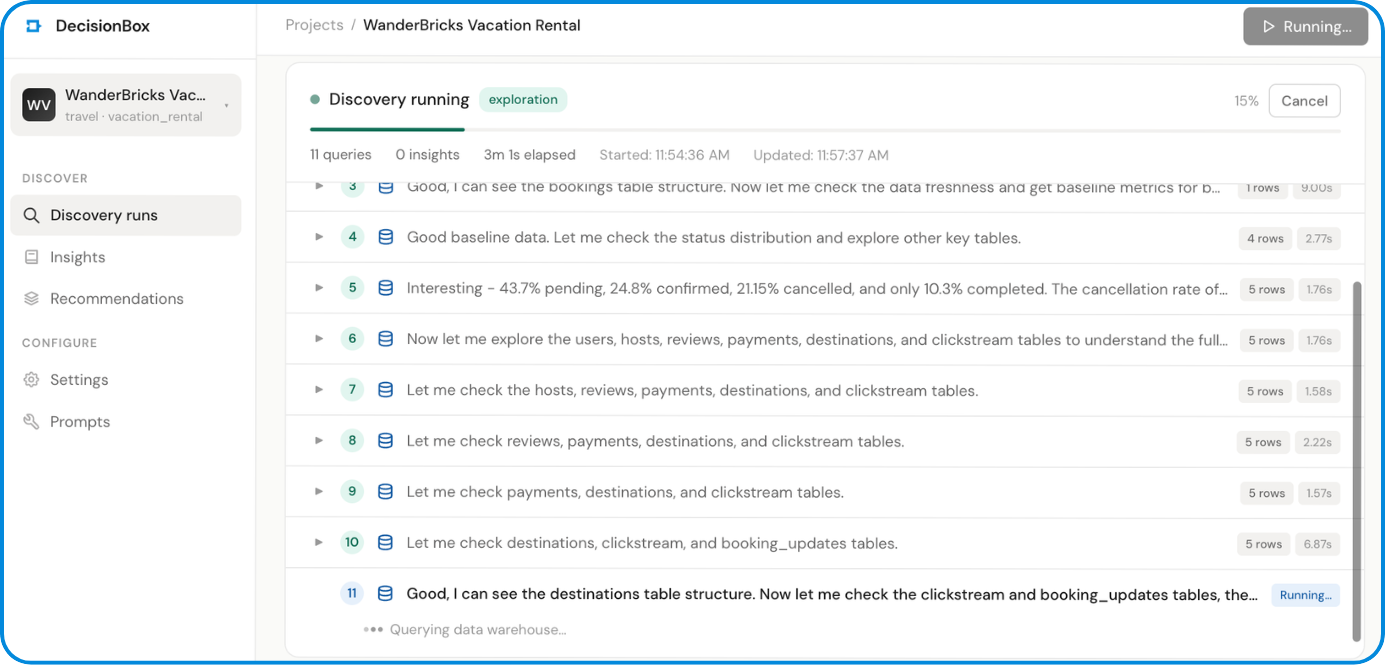
What Happened Next: The AI Agent at Work
DecisionBox's discovery agent is a Go binary that connects to your warehouse and runs an autonomous multi-phase analysis. Here's what it did with the WanderBricks dataset:
Phase 1: Exploration (92 queries)
The agent started by sampling every table (SELECT * FROM ... LIMIT 5) to understand the schema. Then it got to work — progressively writing more complex queries to build a complete picture of the business:
-- Step 3: Baseline metrics
SELECT MIN(created_at) AS earliest_booking,
       MAX(created_at) AS latest_booking,
       COUNT(*) AS total_bookings,
       COUNT(DISTINCT user_id) AS total_guests,
       COUNT(DISTINCT property_id) AS total_properties,
       AVG(total_amount) AS avg_booking_value
FROM `wanderbricks.bookings`
-- Step 22: Spotting the July cancellation spike
SELECT DATE_TRUNC(created_at, MONTH) AS booking_month,
       COUNT(*) AS total_bookings,
       ROUND(SUM(CASE WHEN status = 'cancelled' THEN 1 ELSE 0 END)
             * 100.0 / COUNT(*), 1) AS cancel_rate
FROM `wanderbricks.bookings`
WHERE created_at >= '2025-04-01'
GROUP BY 1
ORDER BY 1
When it saw the July cancellation rate spike to 28.8% (up from ~20%), it didn't stop there. It immediately drilled into why — investigating lead times, same-day bookings, destination breakdowns, and property type correlations. All autonomously.
-- Step 25: Investigating cancellation timing
SELECT CASE
         WHEN TIMESTAMP_DIFF(b.check_in, b.updated_at, DAY) > 30
           THEN '30+ days before'
         WHEN TIMESTAMP_DIFF(b.check_in, b.updated_at, DAY) > 7
           THEN '7-30 days before'
         WHEN TIMESTAMP_DIFF(b.check_in, b.updated_at, DAY) > 0
           THEN '1-7 days before'
         ELSE 'Same day'
       END AS cancel_timing,
       COUNT(*) AS cancellations
FROM `wanderbricks.bookings` b
WHERE status = 'cancelled'
  AND created_at >= '2025-06-01'
GROUP BY 1
Finding: 71% of cancellations happen the same day or day before check-in. The agent flagged this as "devastating for hosts."
Phase 2: Analysis (74 steps)
The agent took everything it learned during exploration and produced structured insights across 7 business areas:
| Analysis Area | Insights | Critical | Confirmed/Adjusted |
|---|---|---|---|
| Booking Conversion | 10 | 4 | 6 |
| Revenue | 10 | 4 | 5 |
| Guest Retention | 8 | 1 | 5 |
| Cancellation | 8 | 2 | 5 |
| Destination | 9 | 2 | 1 |
| Host Performance | 11 | 5 | 7 |
| Guest Satisfaction | 11 | 3 | 4 |
Each insight includes severity, affected count, confidence score, risk score, specific metrics, and supporting indicators — all derived from the data, not predefined templates.
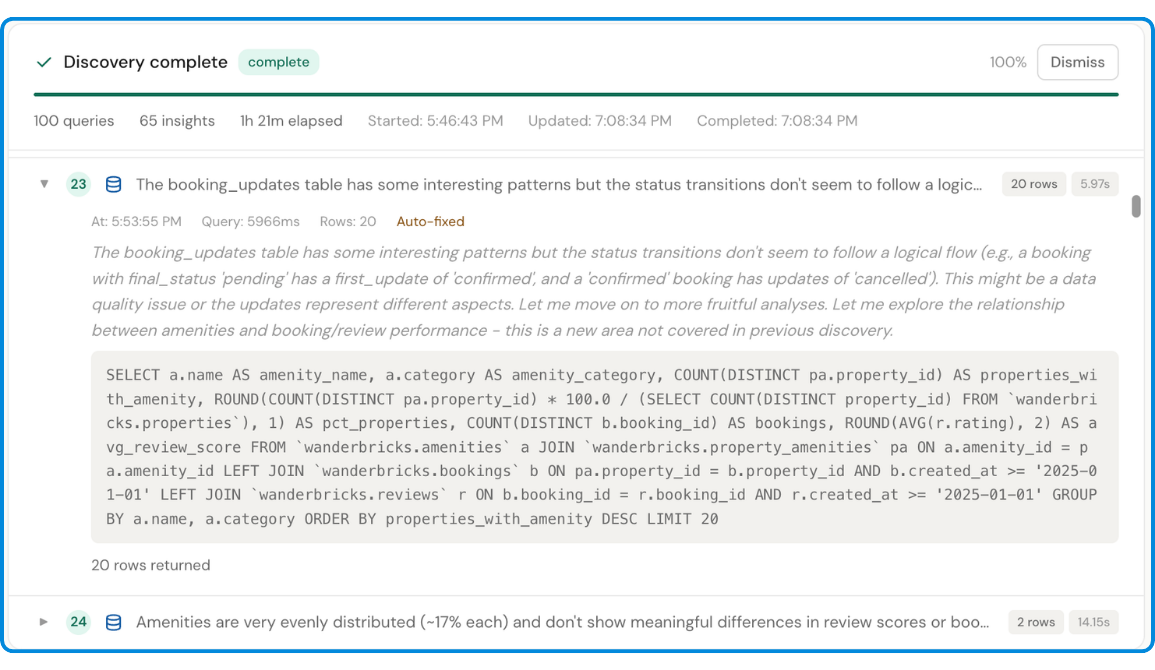
Phase 3: Validation (67 steps)
This is where DecisionBox differentiates itself from "AI that generates reports." Every single insight gets validated. The agent writes a fresh, independent SQL query — different from the one that discovered the finding — and runs it against the warehouse to verify the numbers.
For example, the "July 2025 Cancellation Spike" insight was validated with this query:
SELECT
  COUNT(*) AS total_july_bookings,
  SUM(CASE WHEN status = 'cancelled' THEN 1 ELSE 0 END) AS cancelled_bookings,
  ROUND(SUM(CASE WHEN status = 'cancelled' THEN 1 ELSE 0 END)
        * 100.0 / COUNT(*), 1) AS cancellation_rate_pct,

  -- Same-day bookings
  SUM(CASE WHEN DATEDIFF(check_in_date, booking_date) = 0 THEN 1 ELSE 0 END)
    AS same_day_bookings,

  -- Same-day cancellation rate
  ROUND(SUM(CASE WHEN DATEDIFF(check_in_date, booking_date) = 0
                  AND status = 'cancelled' THEN 1 ELSE 0 END) * 100.0
        / NULLIF(SUM(CASE WHEN DATEDIFF(check_in_date, booking_date) = 0
                     THEN 1 ELSE 0 END), 0), 1) AS same_day_cancel_rate_pct

FROM `wanderbricks.bookings`
WHERE YEAR(booking_date) = 2025
  AND MONTH(booking_date) = 7
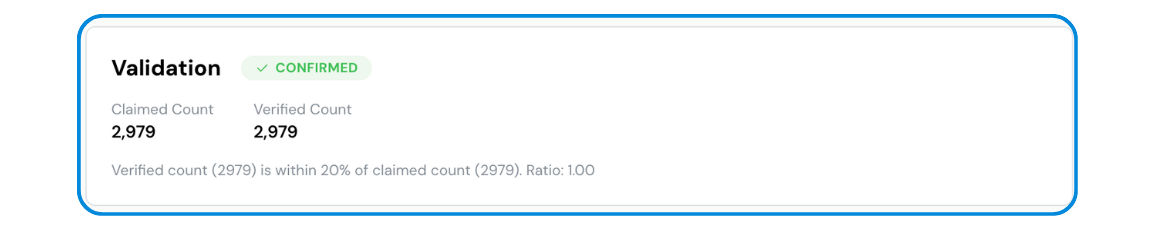
Result: Confirmed. 2,979 cancelled bookings. 28.8% cancellation rate. Numbers match exactly.
Of the 67 insights:
- 21 confirmed — numbers matched exactly
- 12 adjusted — the insight was directionally correct but the validation query found slightly different numbers (the agent updates the insight with the corrected count)
- 1 rejected — the claim didn't hold up under validation and was flagged
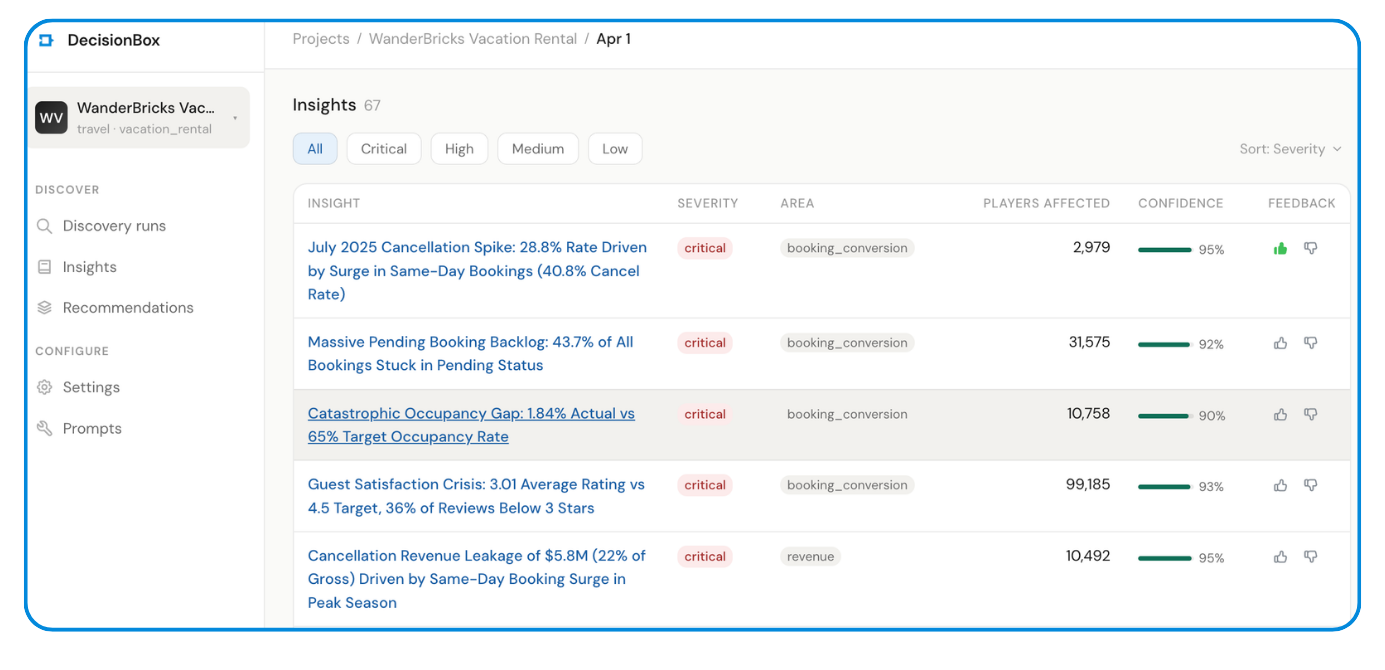
The 5 Most Impactful Discoveries
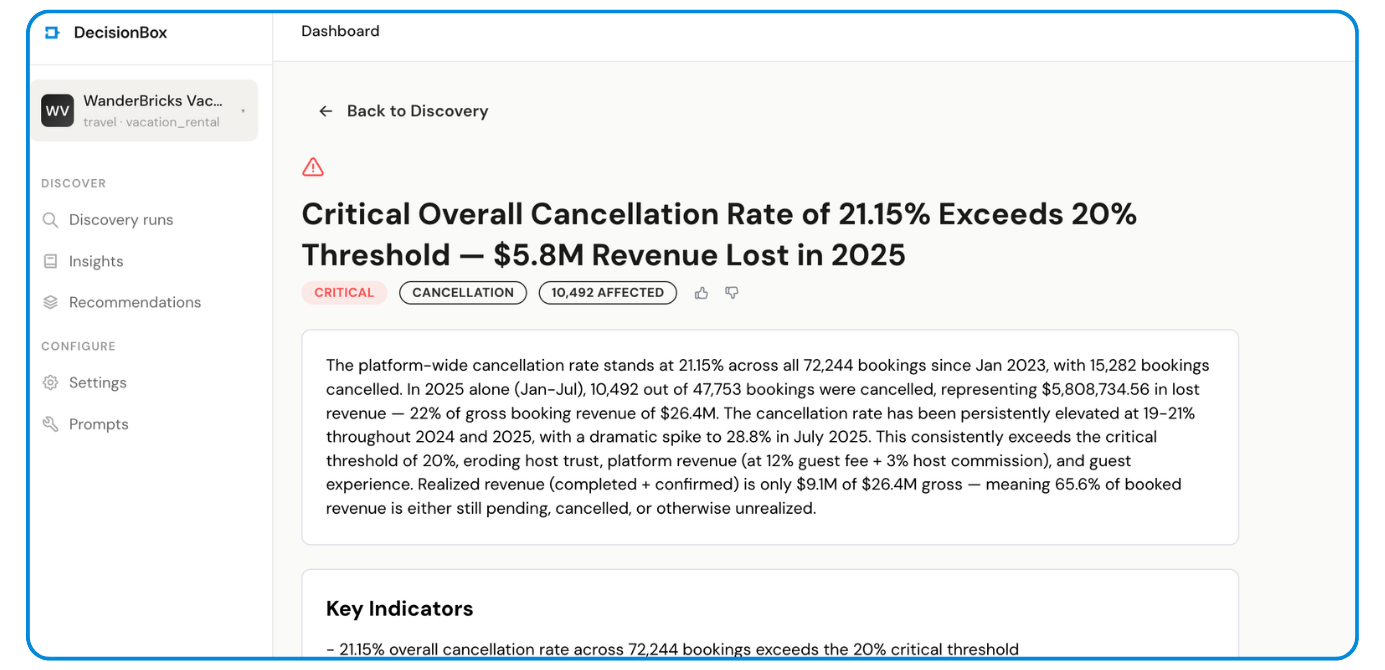
1. $5.8M Revenue Leakage from Cancellations (22% of Gross)
In 2025, 10,492 cancelled bookings represented $5.81M in lost revenue — 22% of the $26.4M total. But the real story was why: same-day bookings surged from 3% of volume in April to 26.4% in July, and these carry a 40.8% cancellation rate.
The agent traced the full causal chain:
- Average lead time collapsed from 52.6 days (April) → 5.9 days (July)
- 71% of cancellations happen same day or day before check-in
- Refund rate climbed from 7% to 9.27% in July ($624K refunded)
- Realized revenue (completed + confirmed) is only $9.1M of $26.4M gross — a 34.4% realization rate
Severity: Critical | Confidence: 95% | Validation: Confirmed
2. 80% of Hosts Never List a Property
14,273 out of 17,764 registered hosts (80.3%) have zero properties on the platform. The host activation rate has been stuck between 17-21% across every quarterly cohort since Q1 2023 — no improvement over 2.5 years.
The agent dug deeper and found the geographic driver: India (6,564 hosts, 2.1% activation) and China (6,330 hosts, 3.8% activation) represent 72.6% of all hosts but only 2.96% of them have listings. Meanwhile, hosts from destination countries show dramatically higher activation — Thailand at 88.7%, France at 82.9%, Italy at 82.0%.
Severity: Critical | Confidence: 95% | Validation: Adjusted (verified 15,567)
3. 43.7% of Bookings Stuck in "Pending" — Never Confirmed
Of 72,244 total bookings, 31,575 (43.7%) remain in pending status. Only 10.3% ever reach "completed." The agent calculated that realized revenue is only $9.1M out of $26.4M in gross booking value — 65.6% of booking value is unrealized.
Severity: Critical | Confidence: 92% | Validation: Confirmed (31,575 exactly)
4. Guest Satisfaction Crisis: 3.01 Average vs 4.5 Target
The platform-wide average review rating is 3.01 — 33% below the 4.5 target. What makes this remarkable is how uniformly bad it is: the agent checked every dimension and found the same 3.0 rating across all destinations, all property types, all price tiers, and all time periods.
The agent also connected this to retention: guests with 1-2 star average reviews have a 7.35% repeat rate vs 25.6% for those with 3-4 star averages.
Severity: Critical | Confidence: 97% | Validation: Confirmed (99,185 reviews)
5. 1.84% Occupancy Rate vs 65% Target
Across 10,758 properties over 12 months, only 72,200 nights were booked from 3.93M available — 1.84% occupancy. The average property gets 6.7 booked nights per year. The platform has approximately 35x more supply than demand.
Severity: Critical | Confidence: 90% | Validation: Adjusted (18,163 properties counted)
Why This Matters for Databricks Users
If you're using Databricks, your data warehouse already has the answers to your most important business questions. The problem is that finding them requires:
- Knowing what to ask — an analyst needs to hypothesize "maybe same-day bookings are driving cancellations" before writing the query
- Writing the SQL — Databricks SQL is powerful but someone has to write it
- Connecting the dots — the cancellation spike, the lead time collapse, the refund rate increase, and the host activation failure are all related, but different teams would typically investigate them in isolation
- Validating the findings — dashboards show numbers but don't verify whether those numbers actually support the conclusion
DecisionBox does all four autonomously. It connects directly to your Databricks SQL Warehouse, explores your data without any guidance, and comes back with validated, actionable insights.
What the Agent Did That a Dashboard Can't
The agent's reasoning chain during exploration is what sets this apart. When it saw a 28.8% cancellation rate in July, it didn't just flag the number — it:
- Compared July to prior months to confirm it was anomalous
- Checked if the spike was isolated to specific property types (it wasn't)
- Investigated booking lead times and discovered the same-day surge
- Calculated the cancellation rate by lead time bucket to prove causation
- Cross-referenced with refund data to quantify the financial impact
- Checked if host ratings correlated with cancellations (they didn't)
- Looked at destination-level patterns to see if it was geographic (Byron Bay 37.2%, London 34.5%)
That's 7 layers of investigation, each informed by the previous one. A dashboard would show you the 28.8% number. The agent tells you why it happened.
The Numbers
| Metric | Value |
|---|---|
| Setup time | ~5 minutes |
| Discovery duration | 76 minutes |
| SQL queries executed | 233 (92 exploration + 74 analysis + 67 validation) |
| Query success rate | 96.7% (the agent self-corrected Databricks SQL syntax errors) |
| Tables analyzed | 11 |
| Insights generated | 67 |
| Critical insights | 17 |
| Validated (confirmed + adjusted) | 33 of 67 (49%) |
| Analysis areas covered | 7 (booking conversion, revenue, guest retention, cancellation, destination, host performance, guest satisfaction) |
| AI model used | Claude Opus (via Vertex AI) |
Try It Yourself
DecisionBox is open source (AGPL v3) and available on GitHub.
To run the same analysis on your Databricks warehouse:
- Deploy —
docker compose upfor local, or use our Helm charts for Kubernetes - Connect — Add your Databricks SQL Warehouse host, HTTP path, and PAT
- Discover — Hit Run Discovery and let the agent work
The agent works with any Databricks catalog and schema. It adapts to your data — no domain-specific configuration required for the general discovery mode.
Supported Warehouses
DecisionBox isn't limited to Databricks. It also connects to:
- Snowflake — Username/password or key pair auth
- BigQuery — ADC or service account key
- Redshift — IAM role, access keys, or assume role
- PostgreSQL — Standard connection
What's Next
This was a general discovery run — no domain pack, no pre-defined analysis areas. DecisionBox also supports domain packs that bring industry-specific knowledge to the analysis. Our gaming and social domain packs, for example, know about retention cohorts, monetization funnels, and engagement metrics specific to those industries.
We're building domain packs for travel, e-commerce, SaaS, and fintech next. If you're interested in contributing or have a dataset you'd like to see analyzed, open a discussion on GitHub.
DecisionBox is an open-source AI-powered data discovery platform. It connects to your data warehouse, runs autonomous AI agents, and surfaces validated insights — no SQL, no dashboards, no manual analysis. Star us on GitHub