Your First AI Discovery: E-Commerce Dataset on Redshift

We're excited to introduce DecisionBox — an open-source platform that connects to your data warehouse, runs autonomous AI agents, and delivers validated insights and actionable recommendations. No queries to write. No dashboards to build. No questions to ask. Just point it at your data and let it discover what matters.
Before jumping into a hands-on tutorial, let's talk about what DecisionBox is and why we built it.
The Problem: Your Data Knows More Than You're Asking
Every data team has the same bottleneck: insights only come from questions someone thought to ask. A PM has a hunch, an analyst writes queries, iterates, reports back. It's serial and slow. And the biggest problem? It only finds answers to questions someone thought to ask.
What DecisionBox Does
DecisionBox flips this process. Instead of humans writing queries to answer specific questions, an AI agent autonomously explores your data and tells you what it found.
Here's how it works — three steps:
Connect your warehouse — BigQuery, Redshift, Snowflake, Databricks, PostgreSQL. No data transfer, no schema migration. Your data stays where it is.
Discover — The agent discovers your schema, writes SQL queries, executes them, and iterates based on results. Dozens of queries per run, each building on the last. Not a chatbot — an autonomous investigator.
Act on what it finds — Insights with severity, affected counts, and confidence scores. Recommendations with expected impact, target segments, and implementation steps.
Validate — This is where DecisionBox differs from other AI analytics tools. Any LLM can generate plausible-sounding findings. DecisionBox verifies them. Every insight goes through two independent validation passes against your actual data: one catches inflated numbers, the other generates entirely new SQL queries to confirm each finding from a different angle. Insights come back as confirmed, adjusted with corrected numbers, or rejected. Every query and reasoning step is fully auditable. No black box.
The platform is industry-agnostic, but domain packs give the agent specialized expertise per industry (E-commerce, Gaming, Social Networks today — open source means anyone can add more). It's licensed under AGPL v3, deploys on your infrastructure, and works with your choice of LLM provider — Claude, OpenAI, Azure AI Foundry, Vertex AI, Bedrock, or local models via Ollama.
Let's See It in Action
The best way to understand DecisionBox is to use it. In the rest of this post, I'll walk you through a complete end-to-end tutorial:
- Set up DecisionBox locally (3 commands, 5 minutes)
- Import a real e-commerce dataset from Kaggle into Amazon Redshift Serverless
- Create a project with the E-commerce domain pack
- Run a discovery and explore the results
By the end, you'll have a completed AI discovery run with real insights from real data — and a clear picture of how DecisionBox works.
What You'll Need
- Docker Desktop (Docker 24+ with Compose v2+)
- An AWS account with permissions to create Redshift Serverless resources and S3 buckets
- An Anthropic API key for Claude (console.anthropic.com)
- A Kaggle account to download the dataset
Step 1: Set Up DecisionBox Locally
DecisionBox runs as three services — an API server, a dashboard, and MongoDB — all orchestrated with Docker Compose.
git clone https://github.com/decisionbox-io/decisionbox-platform.git
cd decisionbox-platform
docker compose up -d
That's it. After about 10 seconds, open http://localhost:3000 and you should see the DecisionBox dashboard.
You can verify everything is healthy:
curl http://localhost:8080/health/ready
You should get a 200 OK response.
Step 2: Get the Dataset
We'll use the eCommerce Behavior Data from Multi Category Store dataset from Kaggle, provided by REES46 Marketing Platform via their Open CDP project. It contains real behavioral data from a large multi-category online store (similar to Amazon or eBay).
Download both CSV files:
2019-Oct.csv(~5.6GB, ~42M events)2019-Nov.csv(~9.5GB, ~67M events)
Each row is a single event with these columns:
| Column | Description |
|---|---|
event_time | When the event happened (UTC) |
event_type | view, cart, remove_from_cart, or purchase |
product_id | Unique product identifier |
category_id | Product's category ID |
category_code | Human-readable category (e.g., electronics.smartphone) |
brand | Brand name (may be null) |
price | Product price in USD |
user_id | Permanent user identifier |
user_session | Session identifier |
This is a rich dataset for e-commerce analysis — it has the full purchase funnel (view → cart → purchase), product categorization, pricing, and session-level behavior.
Step 3: Set Up Amazon Redshift Serverless
We need somewhere to put this data so DecisionBox can query it. We'll use Amazon Redshift Serverless — it's pay-per-query, requires no cluster management, and takes a few minutes to set up.
3.1 Create a Redshift Serverless Endpoint
- Open the Amazon Redshift console and select Serverless dashboard from the left menu
- Click Create workgroup
- Give your workgroup a name (e.g.,
decisionbox-tutorial) - Under Namespace, create a new namespace (e.g.,
decisionbox-tutorial-ns) - Set an admin username and password — you'll need these later
- Keep the default settings for everything else and click Create
- Wait 2-3 minutes for the workgroup to become Available
3.2 Upload CSVs to S3
Redshift loads data from S3, so we need to upload our CSVs first.
- Open the S3 console and create a new bucket (e.g.,
decisionbox-tutorial-data) in the same region as your Redshift workgroup - Upload both CSV files to the bucket:
s3://decisionbox-tutorial-data/2019-Oct.csvs3://decisionbox-tutorial-data/2019-Nov.csv
3.3 Set Up IAM Permissions
Your Redshift namespace needs an IAM role that can read from S3:
- Go to IAM → Roles → Create role
- Select Redshift - Customizable as the trusted entity
- Attach the AmazonS3ReadOnlyAccess policy
- Name it (e.g.,
redshift-s3-read-role) and create it - Back in the Redshift Serverless console, go to your Namespace → Security and encryption → Manage IAM roles
- Associate the role you just created
3.4 Create the Table and Load Data
Open the Redshift Query Editor v2 from the Serverless console (or use any SQL client) and run:
CREATE TABLE ecommerce_events (
    event_time      TIMESTAMP,
    event_type      VARCHAR(20),
    product_id      BIGINT,
    category_id     BIGINT,
    category_code   VARCHAR(256),
    brand           VARCHAR(256),
    price           DECIMAL(10,2),
    user_id         BIGINT,
    user_session    VARCHAR(64)
);
Now load both CSV files:
COPY ecommerce_events
FROM 's3://decisionbox-tutorial-data/2019-Oct.csv'
IAM_ROLE 'arn:aws:iam::<YOUR_ACCOUNT_ID>:role/redshift-s3-read-role'
CSV
IGNOREHEADER 1
TIMEFORMAT 'auto'
REGION 'us-east-1';

COPY ecommerce_events
FROM 's3://decisionbox-tutorial-data/2019-Nov.csv'
IAM_ROLE 'arn:aws:iam::<YOUR_ACCOUNT_ID>:role/redshift-s3-read-role'
CSV
IGNOREHEADER 1
TIMEFORMAT 'auto'
REGION 'us-east-1';
Replace <YOUR_ACCOUNT_ID> with your AWS account ID and adjust the region if needed.
The load takes roughly 5-10 minutes per file. Once done, verify:
SELECT COUNT(*) FROM ecommerce_events;
-- Should return ~109M rows (42M Oct + 67M Nov)

SELECT event_type, COUNT(*) as cnt
FROM ecommerce_events
GROUP BY event_type
ORDER BY cnt DESC;
3.5 Configure Network Access
For DecisionBox running locally to reach your Redshift endpoint, you need to make it publicly accessible:
- In the Redshift Serverless console, go to your Workgroup → Data access → Network and security
- Turn on Publicly accessible
- Make sure the associated security group allows inbound traffic on port 5439 from your IP address
Note: For a production setup, you'd use VPC peering or a private endpoint. For this tutorial, public access is fine — just restrict the security group to your IP.
Step 4: Create a Project in DecisionBox
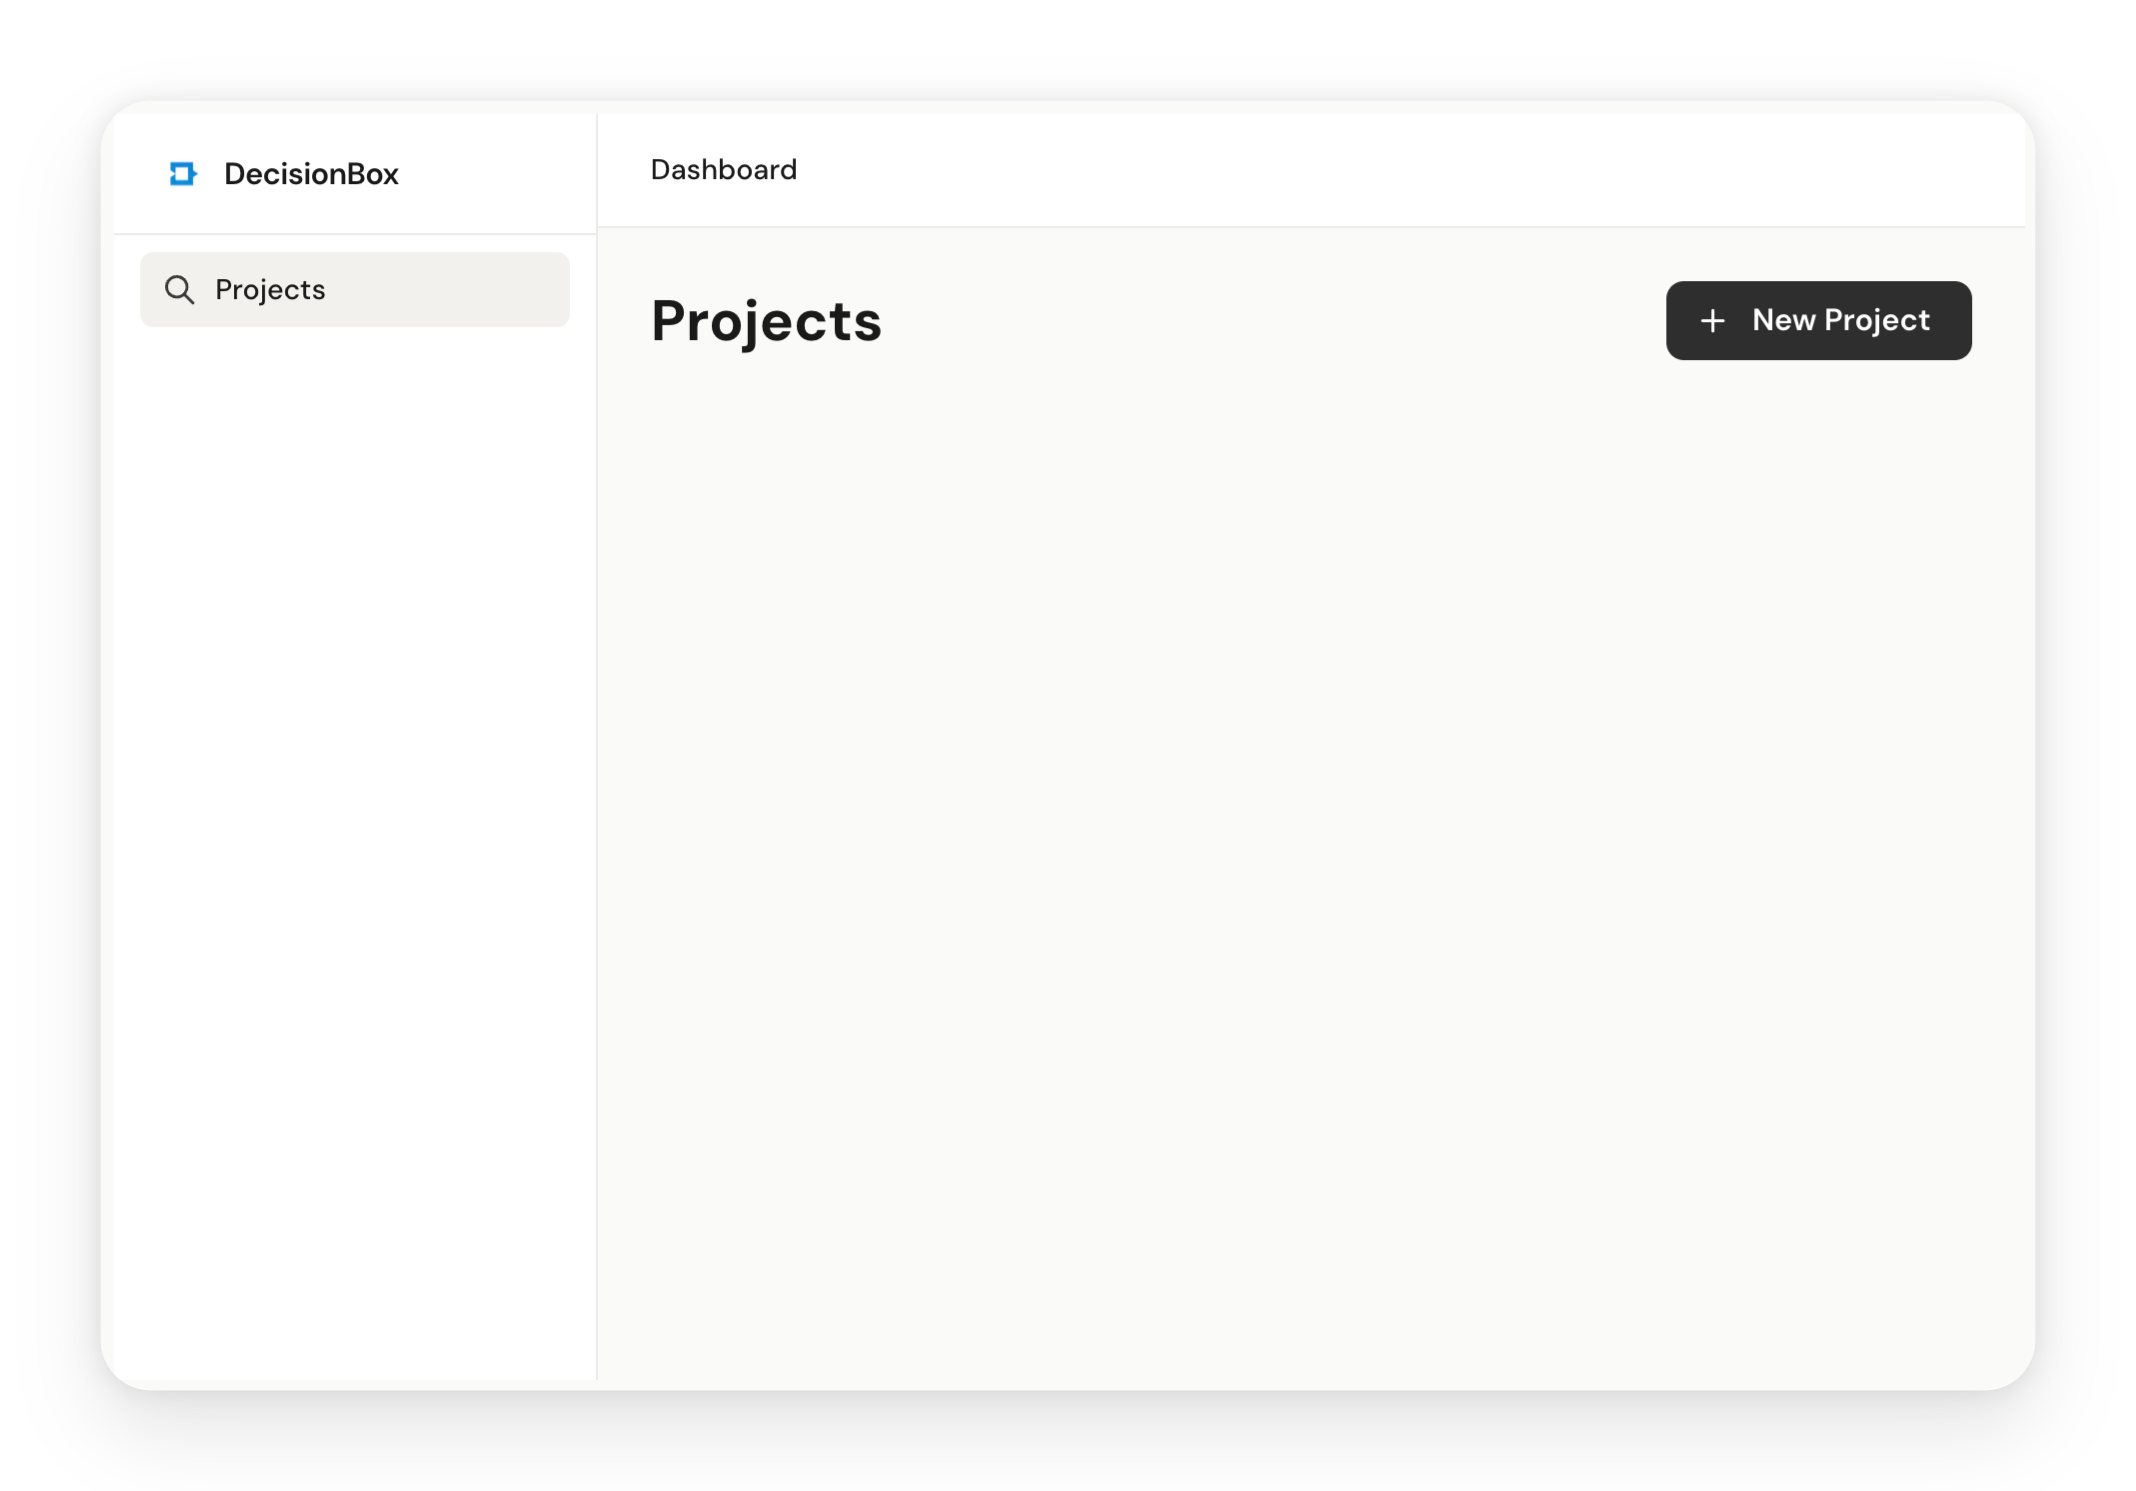
Now for the fun part. Go back to the DecisionBox dashboard at http://localhost:3000 and click Create Project.
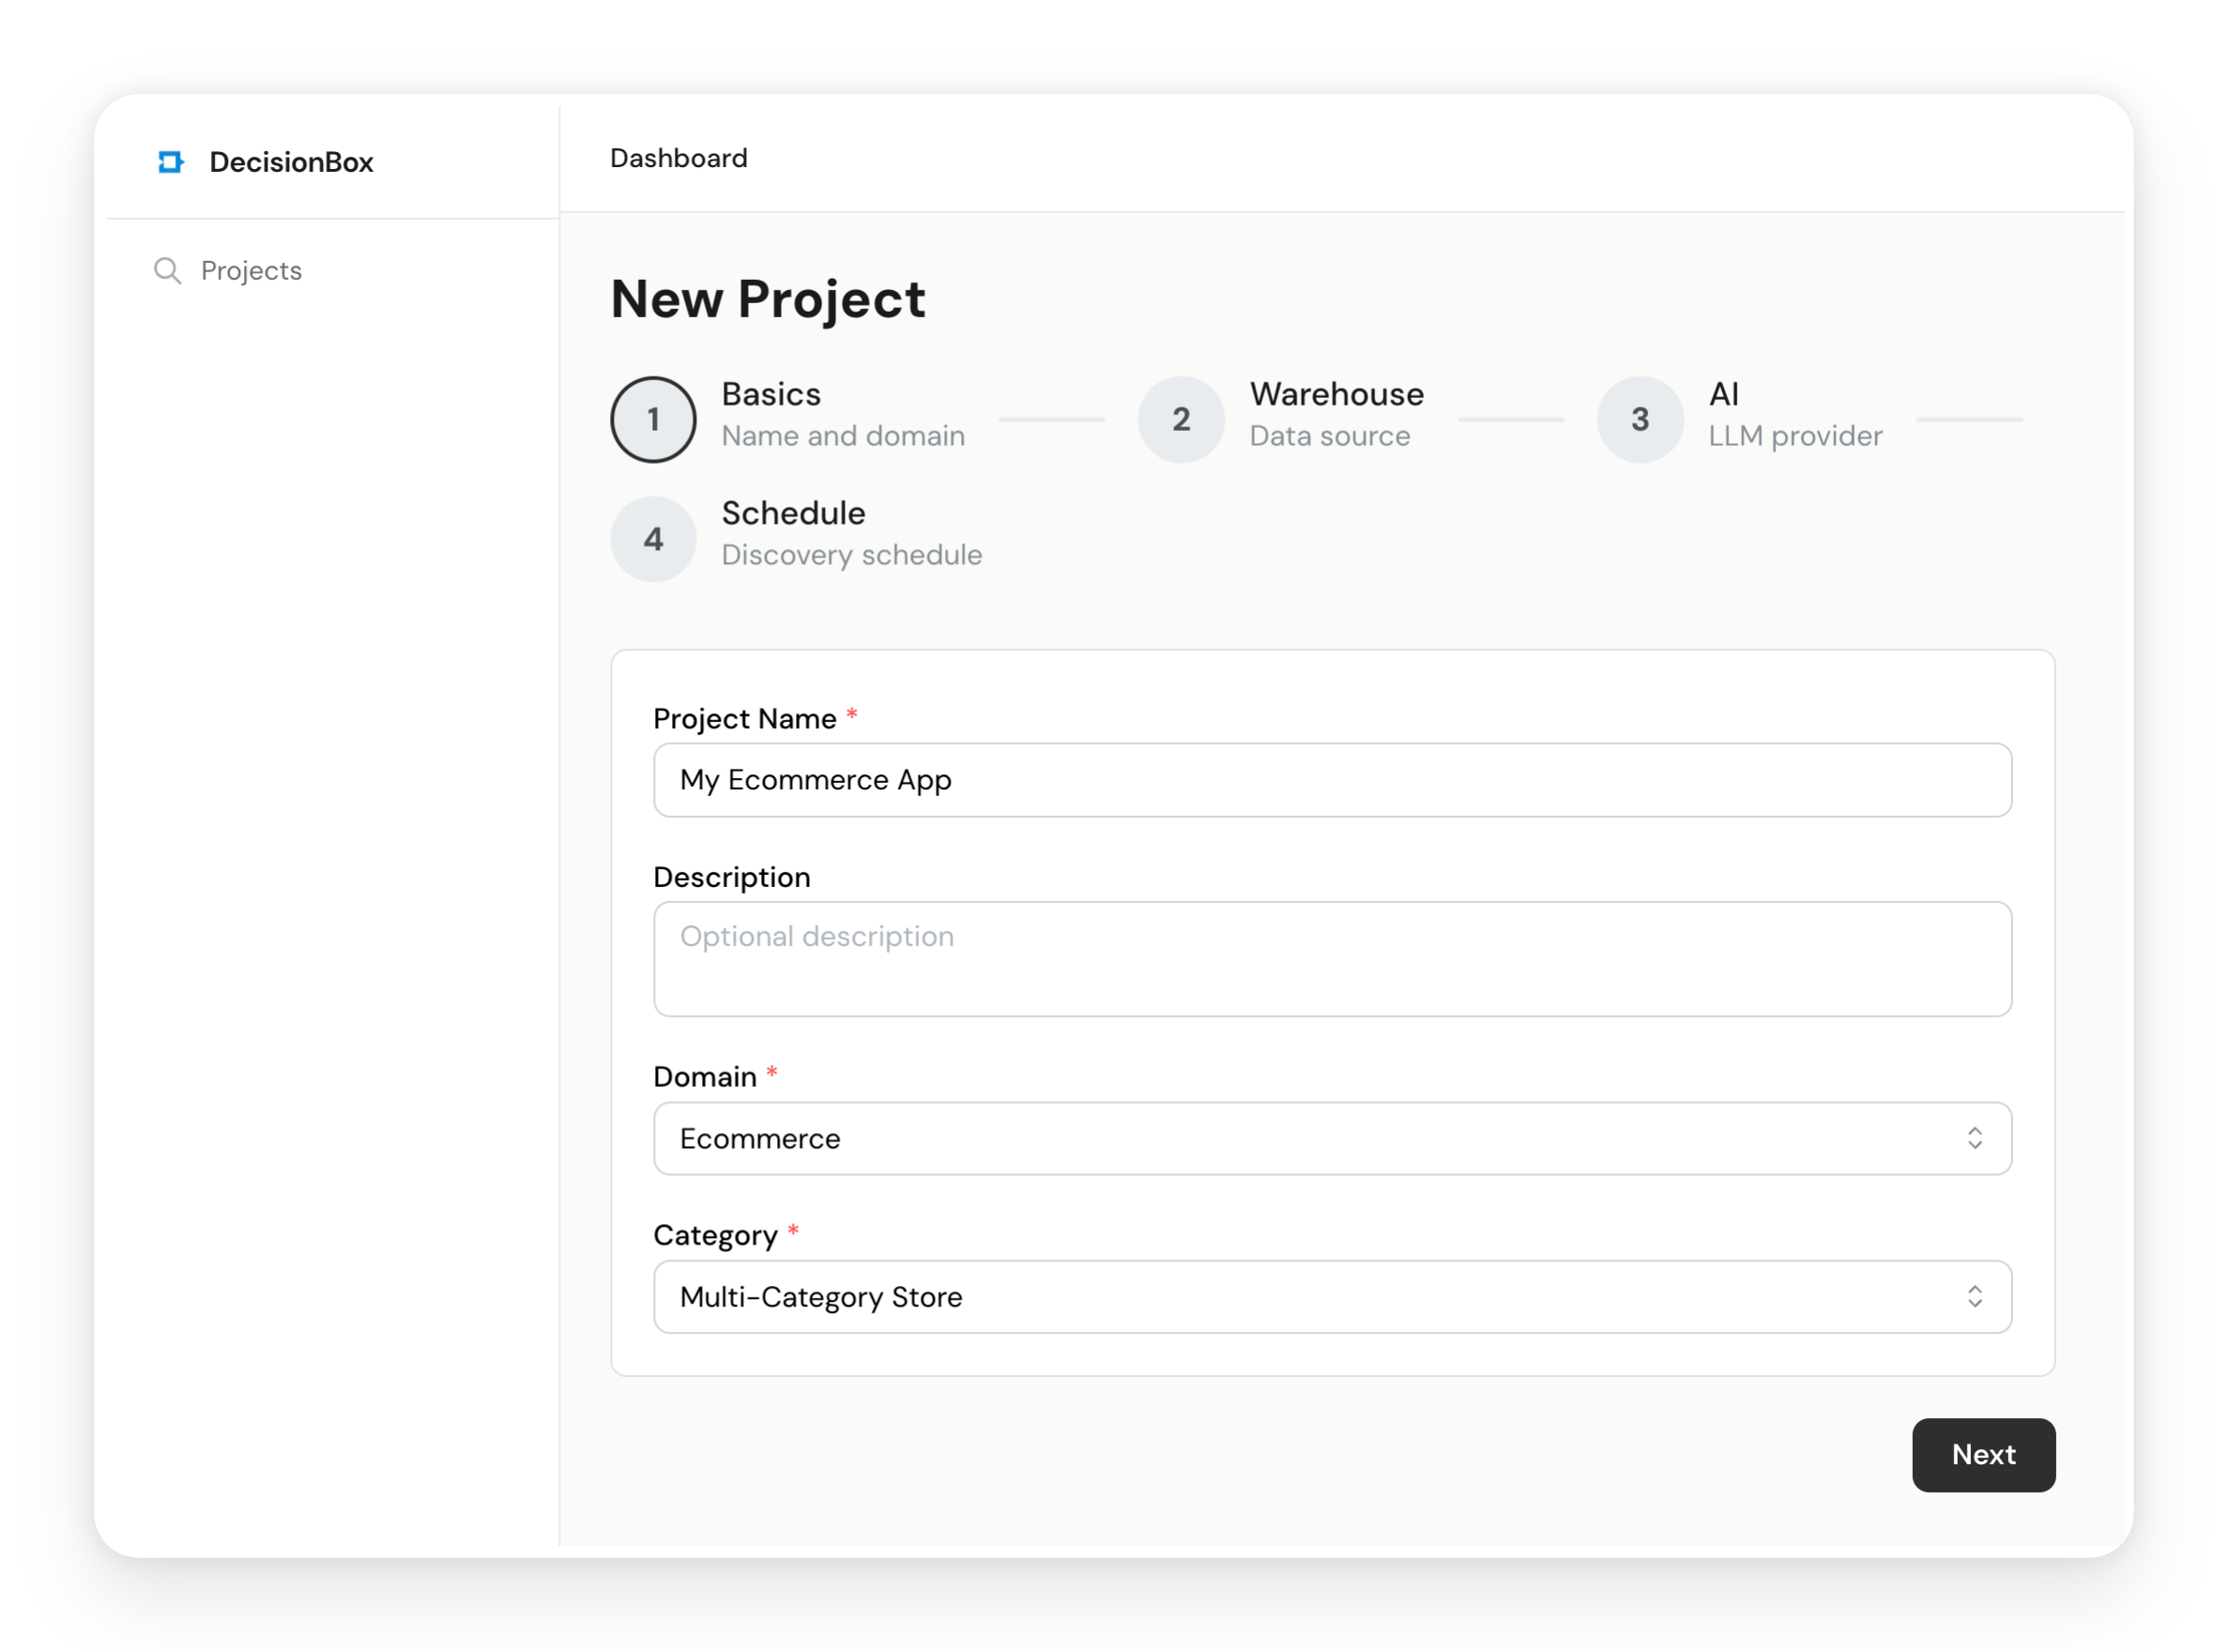
4.1 Basic Configuration
- Name: Give it something descriptive, like "E-Commerce Kaggle — Multi-Category Store"
- Domain: Select Ecommerce
- Category: Select Multi-Category Store
As we covered earlier, the domain and category determine which domain pack the AI agent uses. The E-commerce / Multi-Category pack includes five analysis areas:
- Conversion Funnel — View-to-cart-to-purchase rates, cart abandonment patterns
- Revenue & Pricing — Revenue trends, average order value, pricing dynamics
- Customer Retention — Repeat purchase behavior, customer lifecycle stages
- Product & Category Performance — Category conversion gaps, cross-category affinity, brand performance
- Session & Browsing Behavior — Browse patterns, session depth, discovery-to-action paths
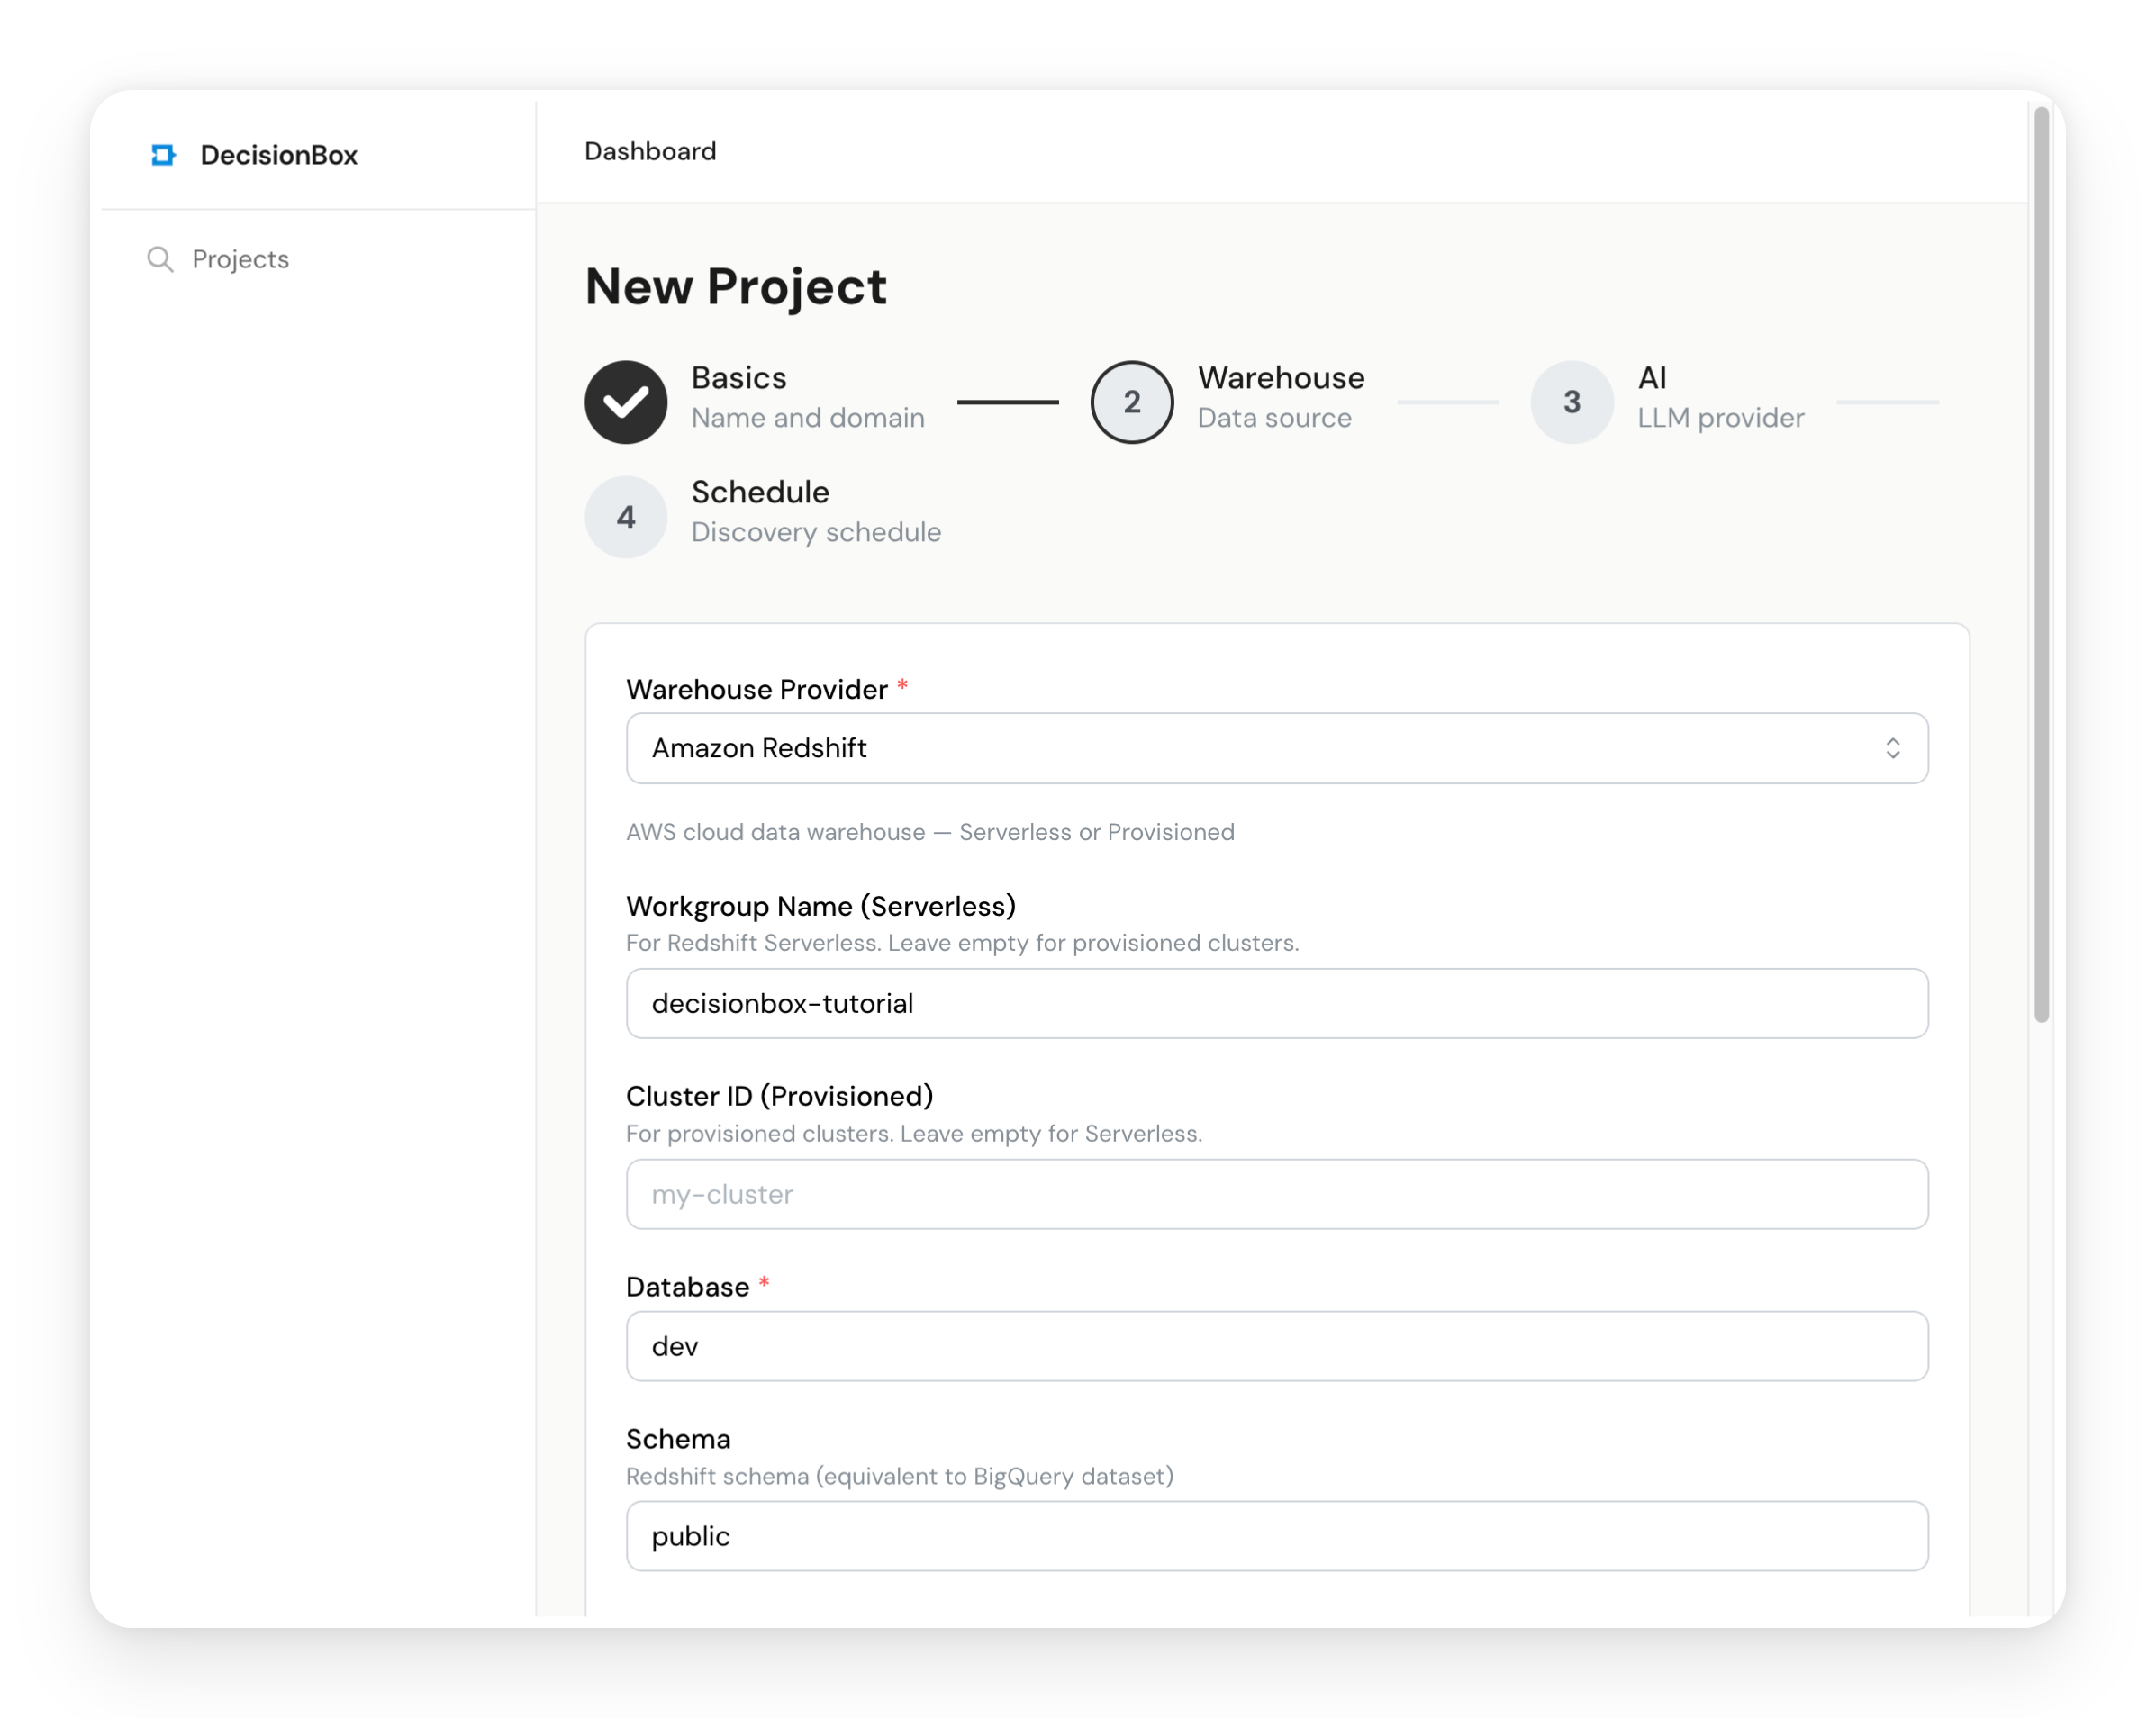
4.2 Data Warehouse Configuration
- Provider: Select Amazon Redshift
- Workgroup Name:
decisionbox-tutorial(or whatever you named it) - Database Name:
dev(the default Redshift database) - Region: Your AWS region (e.g.,
us-east-1) - Authentication: Select Access Keys and enter the admin credentials you set up in Step 3.1
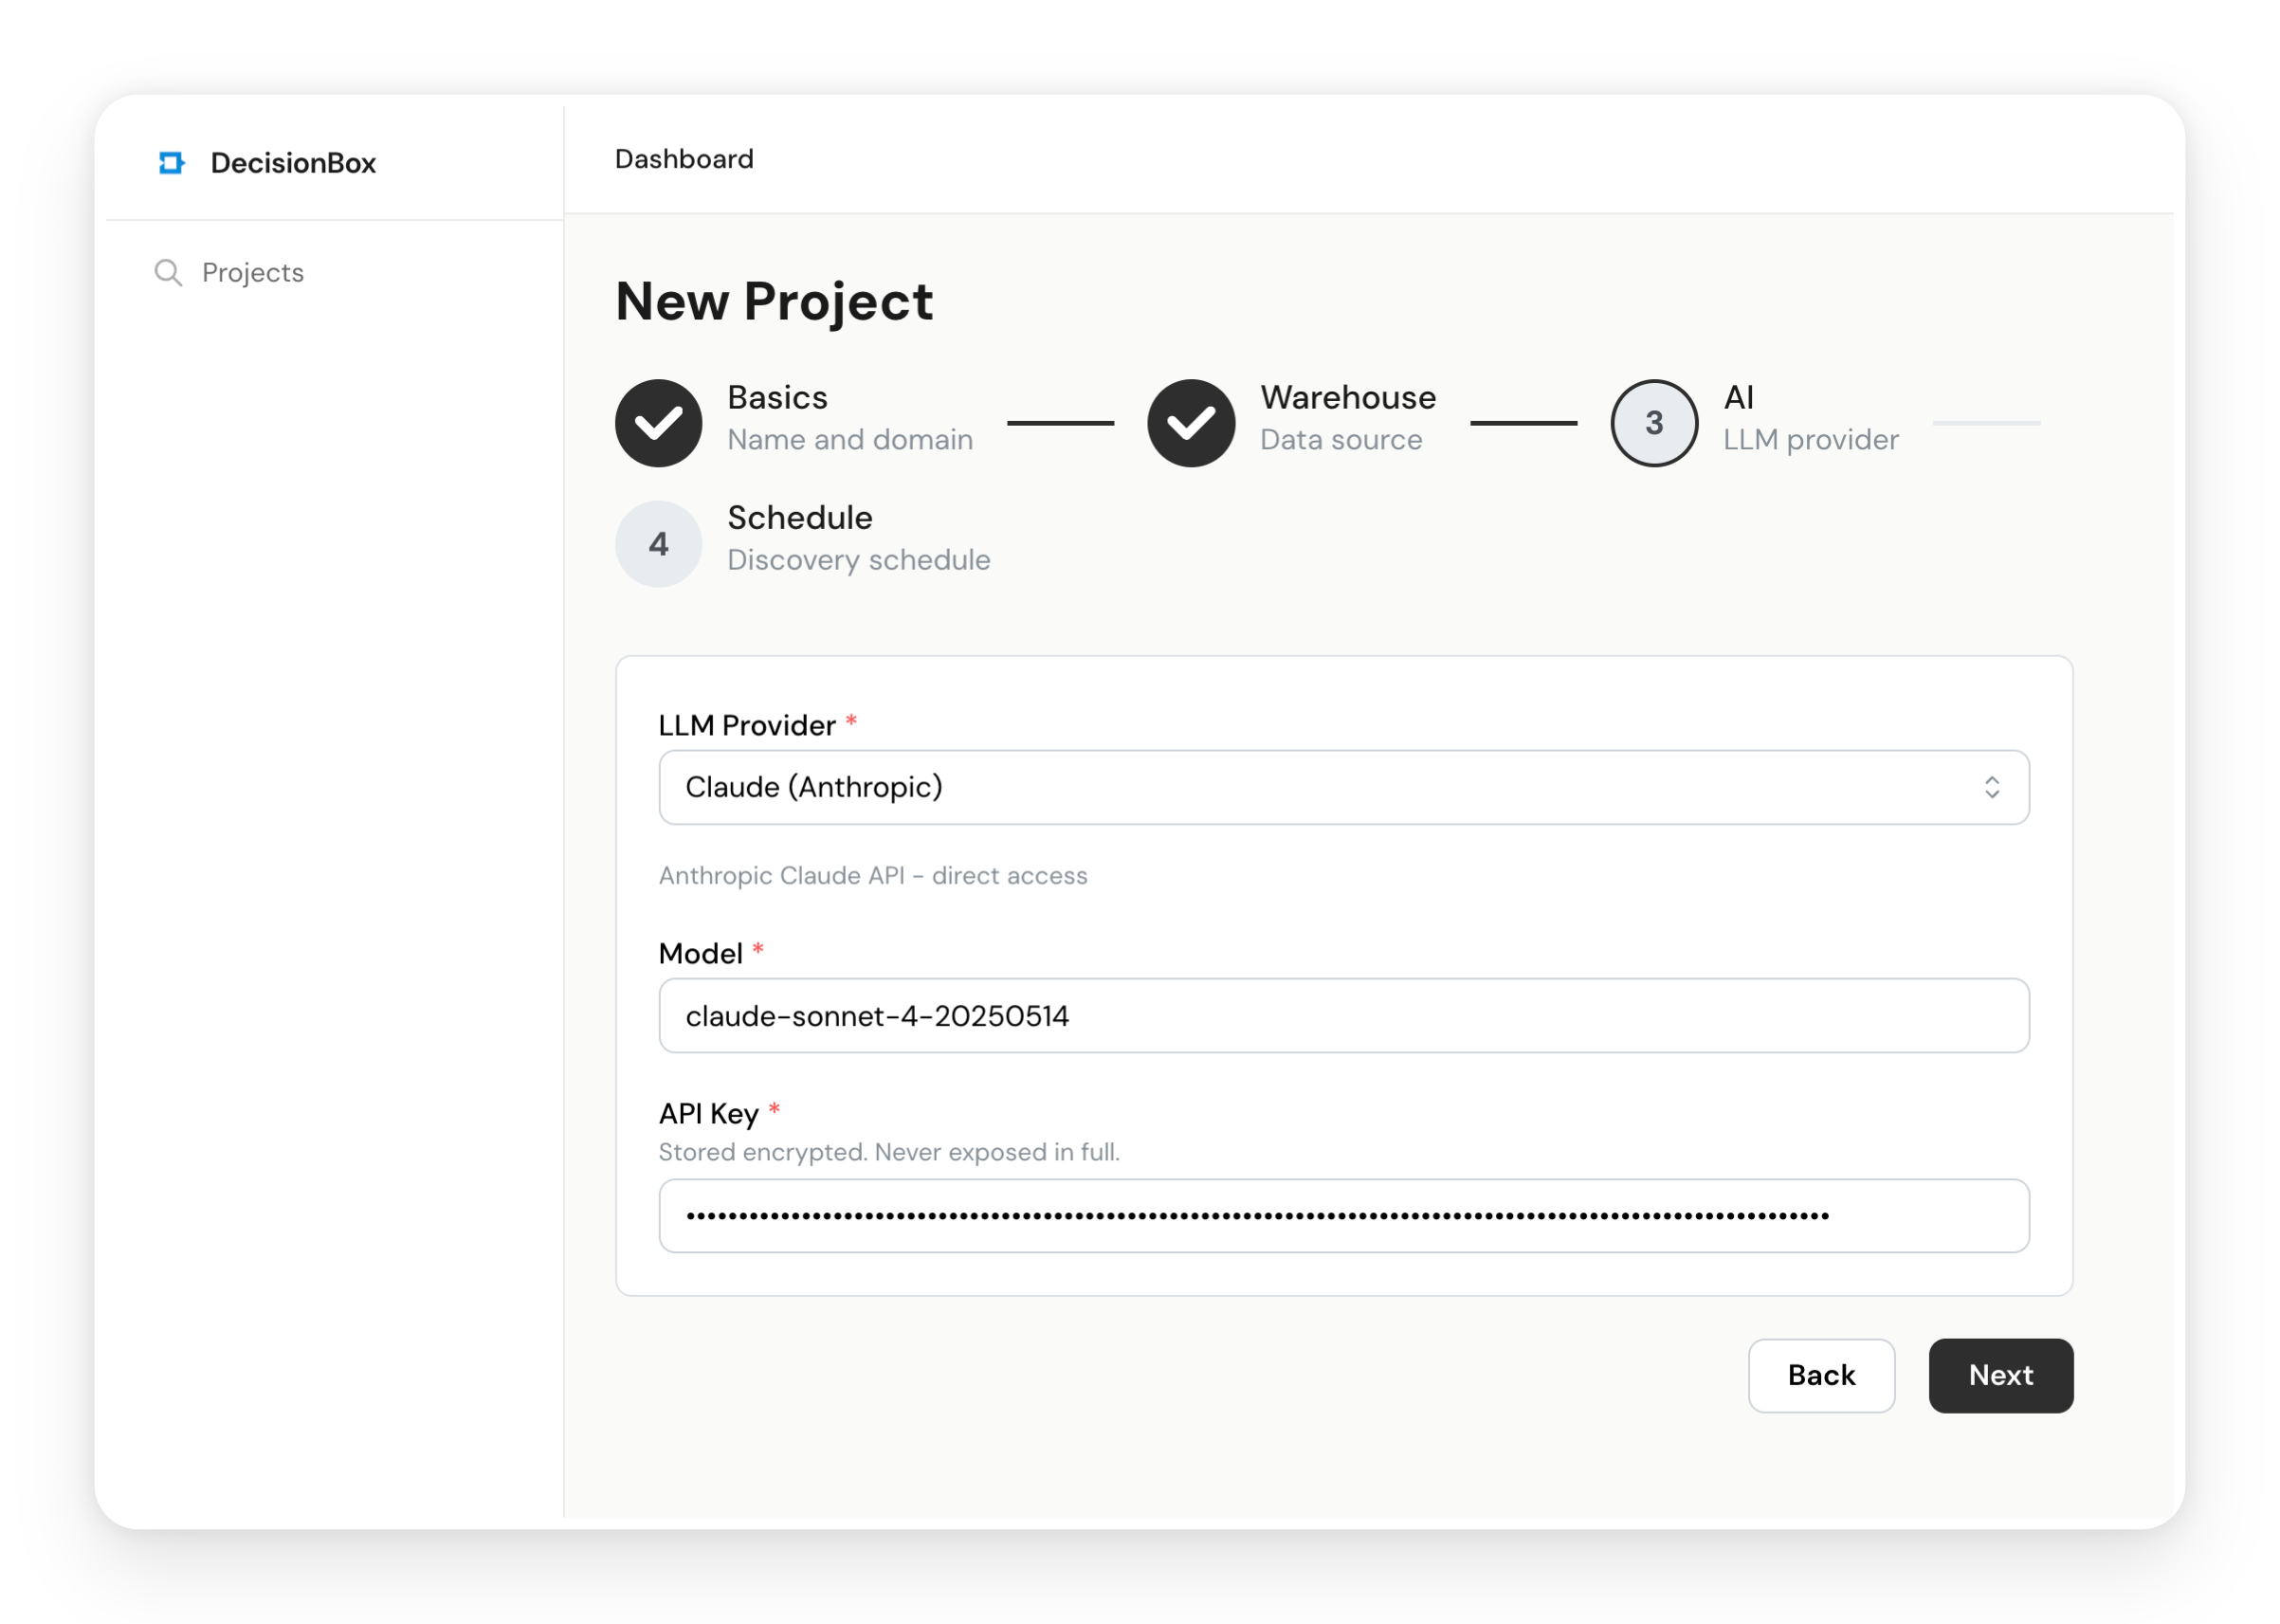
4.3 AI Provider Configuration
- LLM Provider: Select Claude
- Model: Enter
claude-sonnet-4-6 - API Key: Paste your Anthropic API key
Claude Sonnet 4.6 is a strong balance of speed and quality for discovery runs. A typical 100-step run costs about $1-3 in API usage.
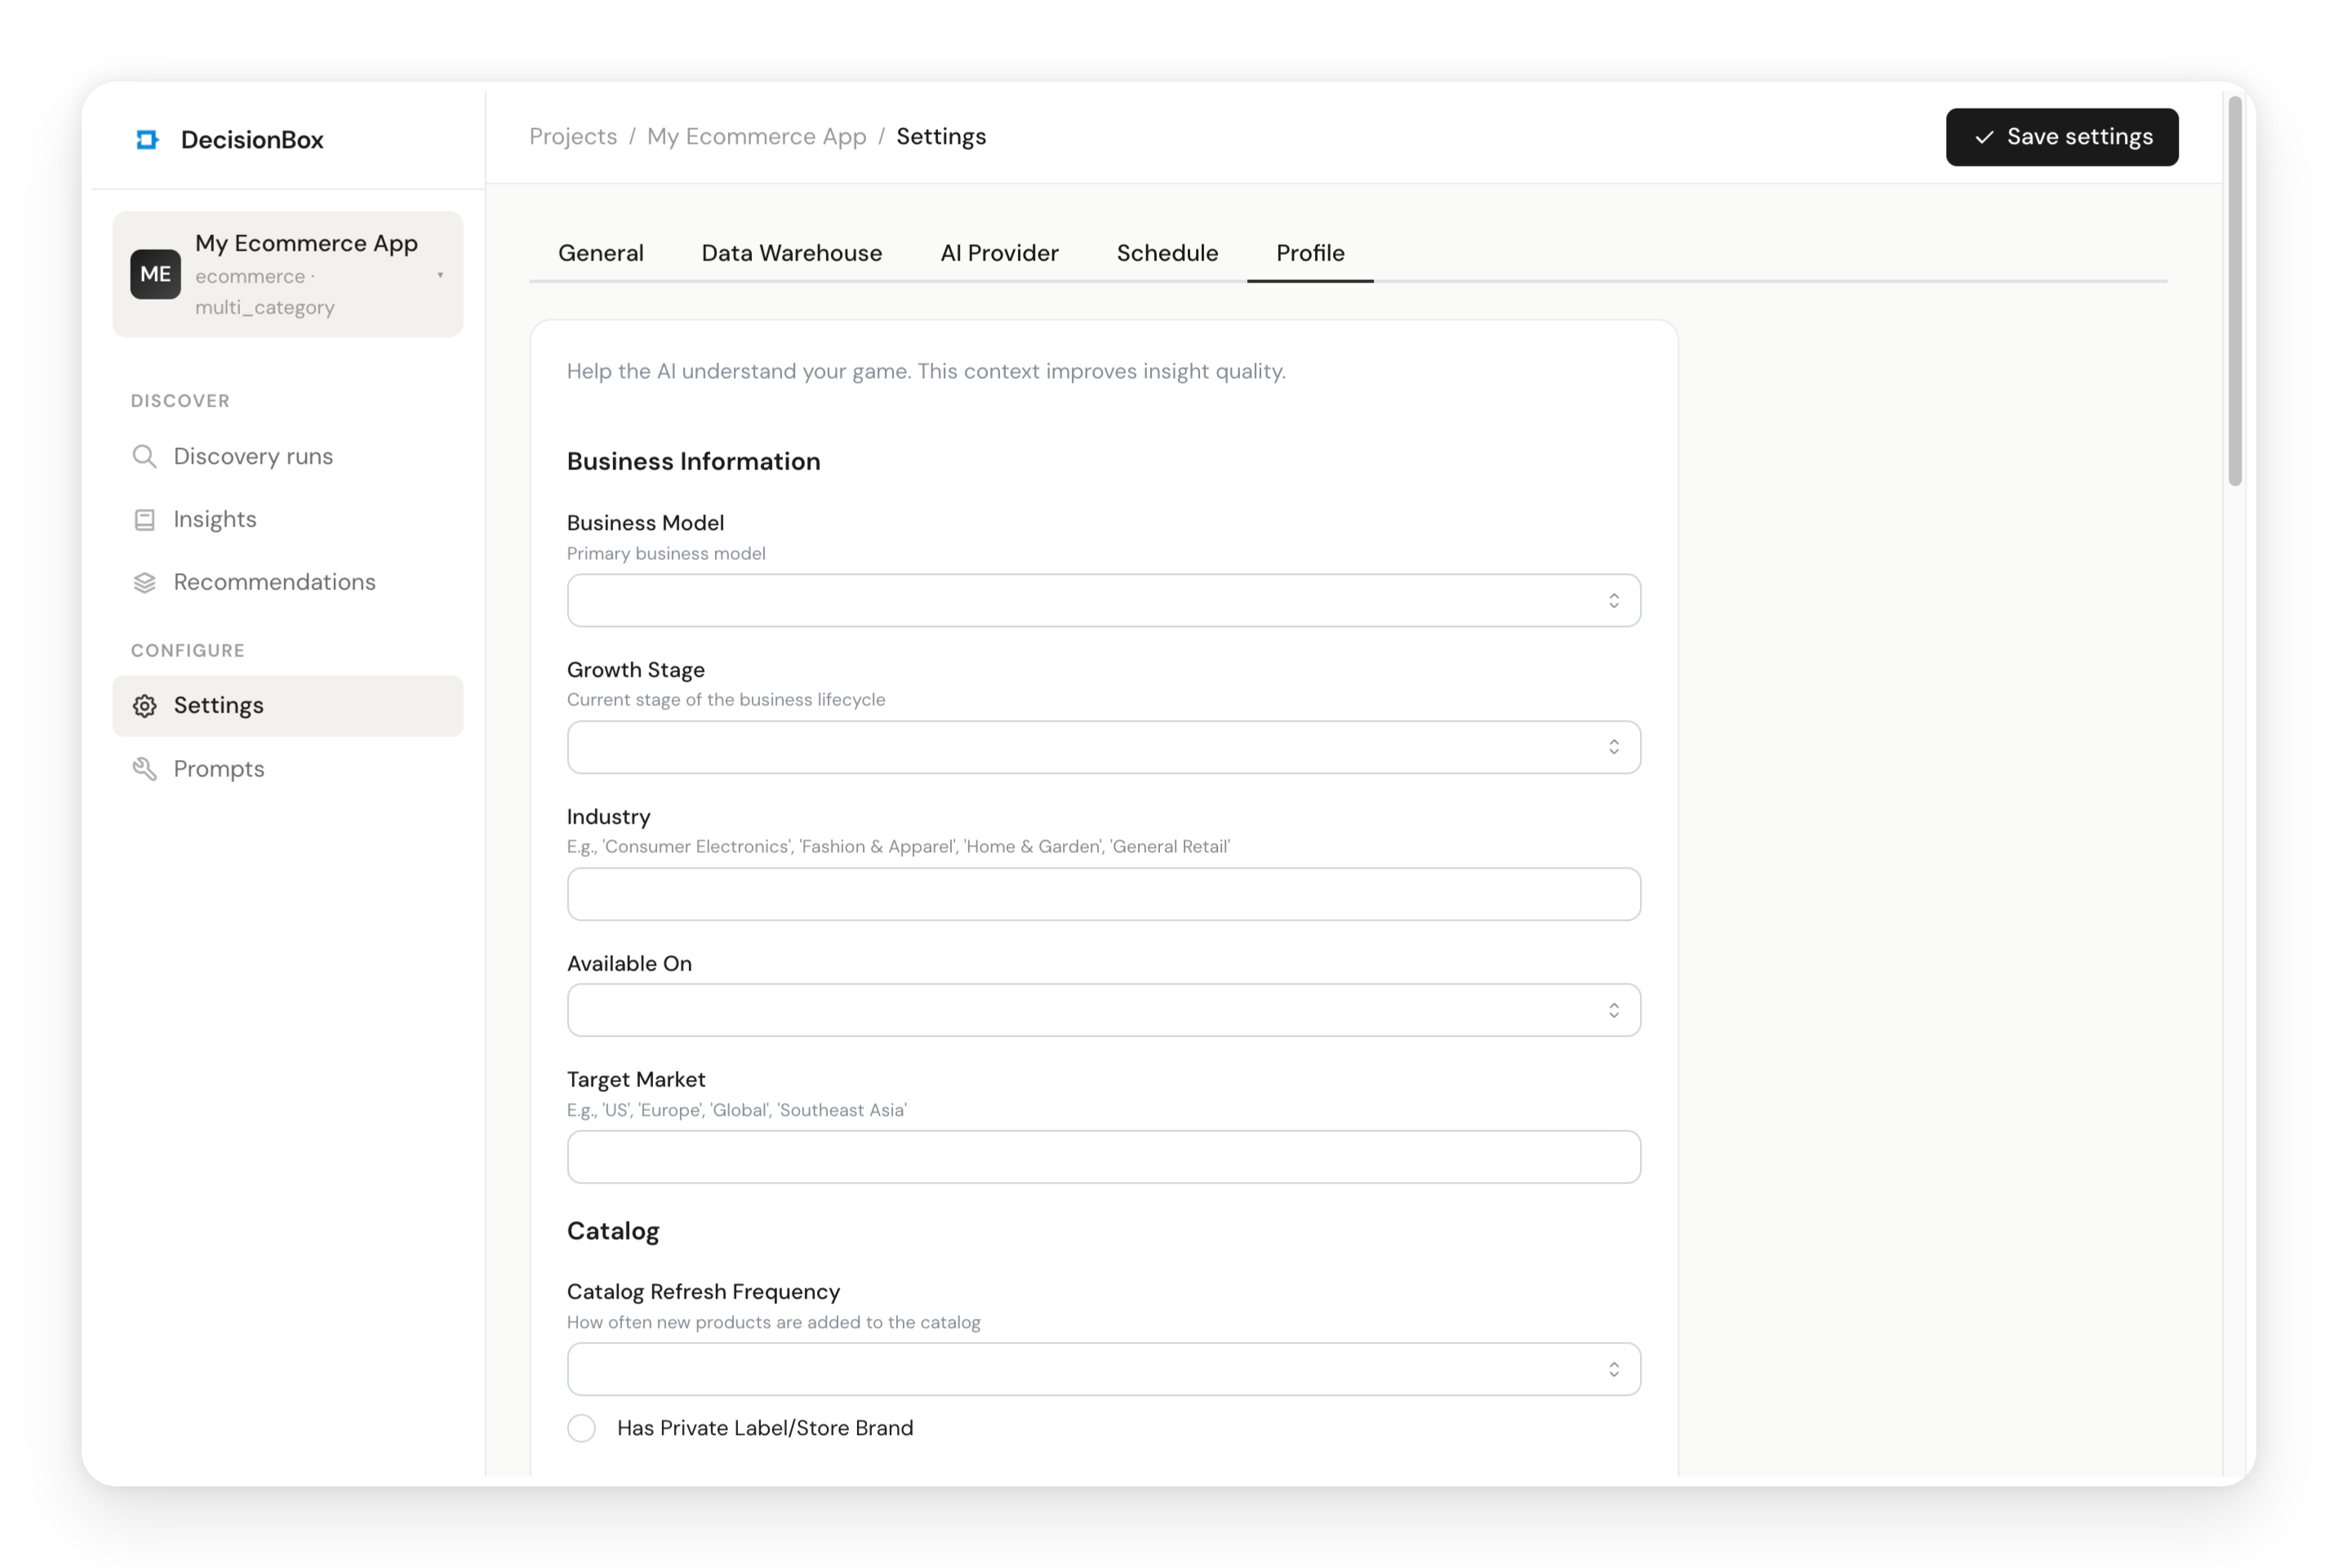
4.4 (Optional) Fill in the Project Profile
Navigate to the Profile tab. The domain pack generates a profile form specific to your store type — business info, product catalog, shipping, KPIs, and more. Filling this in gives the AI agent richer context for better-targeted analysis.
For this tutorial dataset, you might enter:
- Business Model: B2C
- Industry: General Retail / Consumer Electronics
- Target Market: Global
- Total Products: ~200,000+
- Top Categories: Electronics, Appliances, Computers
The more context you provide, the more tailored the insights will be. But it's entirely optional — the agent will discover the data structure on its own.
Step 5: Run Your First Discovery
Click "Run Discovery" from the top bar of your project page.
You'll see a configuration panel:
- Exploration Steps: Set to 10 for a quick first run. This controls how many exploration queries the AI agent will execute. You can increase it later for deeper analysis (the default is 100).
- Areas: Select "Run All Areas" to analyze all five e-commerce areas.
Click Start and watch the agent work.
What's Happening Behind the Scenes
The discovery run follows a structured lifecycle:
-
Schema Discovery — The agent connects to your Redshift endpoint and discovers all tables, columns, and data types. It doesn't need you to describe your schema — it figures it out.
-
Autonomous Exploration — This is the core of the process. The agent writes SQL queries, executes them, reads the results, and decides what to explore next. It starts broad (total events, date ranges, customer counts) and drills into specific patterns (cart abandonment by price range, conversion rates by category, repeat purchase behavior).
-
Analysis — After exploration, the agent runs structured analysis for each of the five areas. It takes the exploration results relevant to each area and produces specific, validated insights.
-
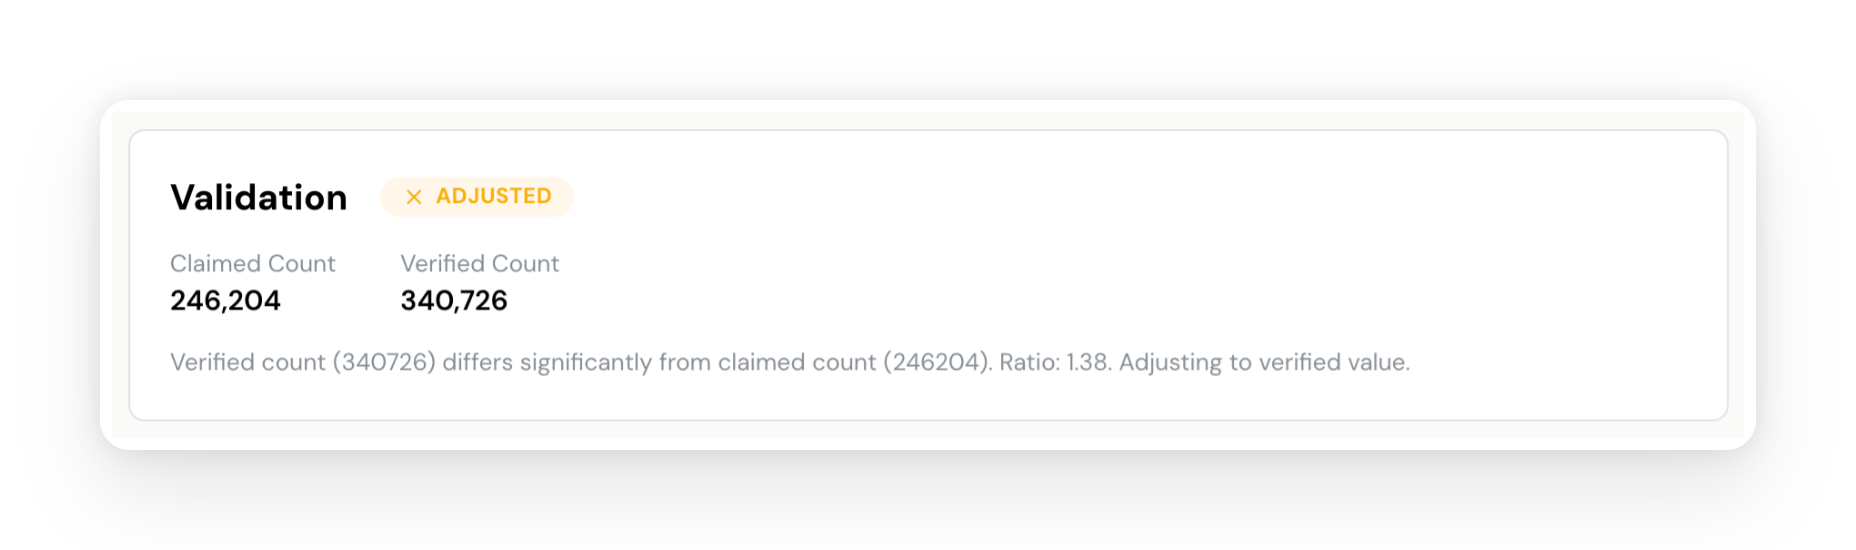
Validation — Every insight goes through two independent validation passes. First, a user count validator ensures affected counts are realistic (not event counts mistaken for user counts). Second, a warehouse verifier generates fresh SQL queries to independently confirm each insight's numbers.
-
Recommendations — Finally, the agent synthesizes all validated insights into actionable recommendations — specific actions your team could implement, with expected impact and implementation steps.
The dashboard shows real-time progress: a progress bar, the current phase, live query counts, and a timeline of the agent's actions. You can see exactly what the agent is thinking and querying at each step.
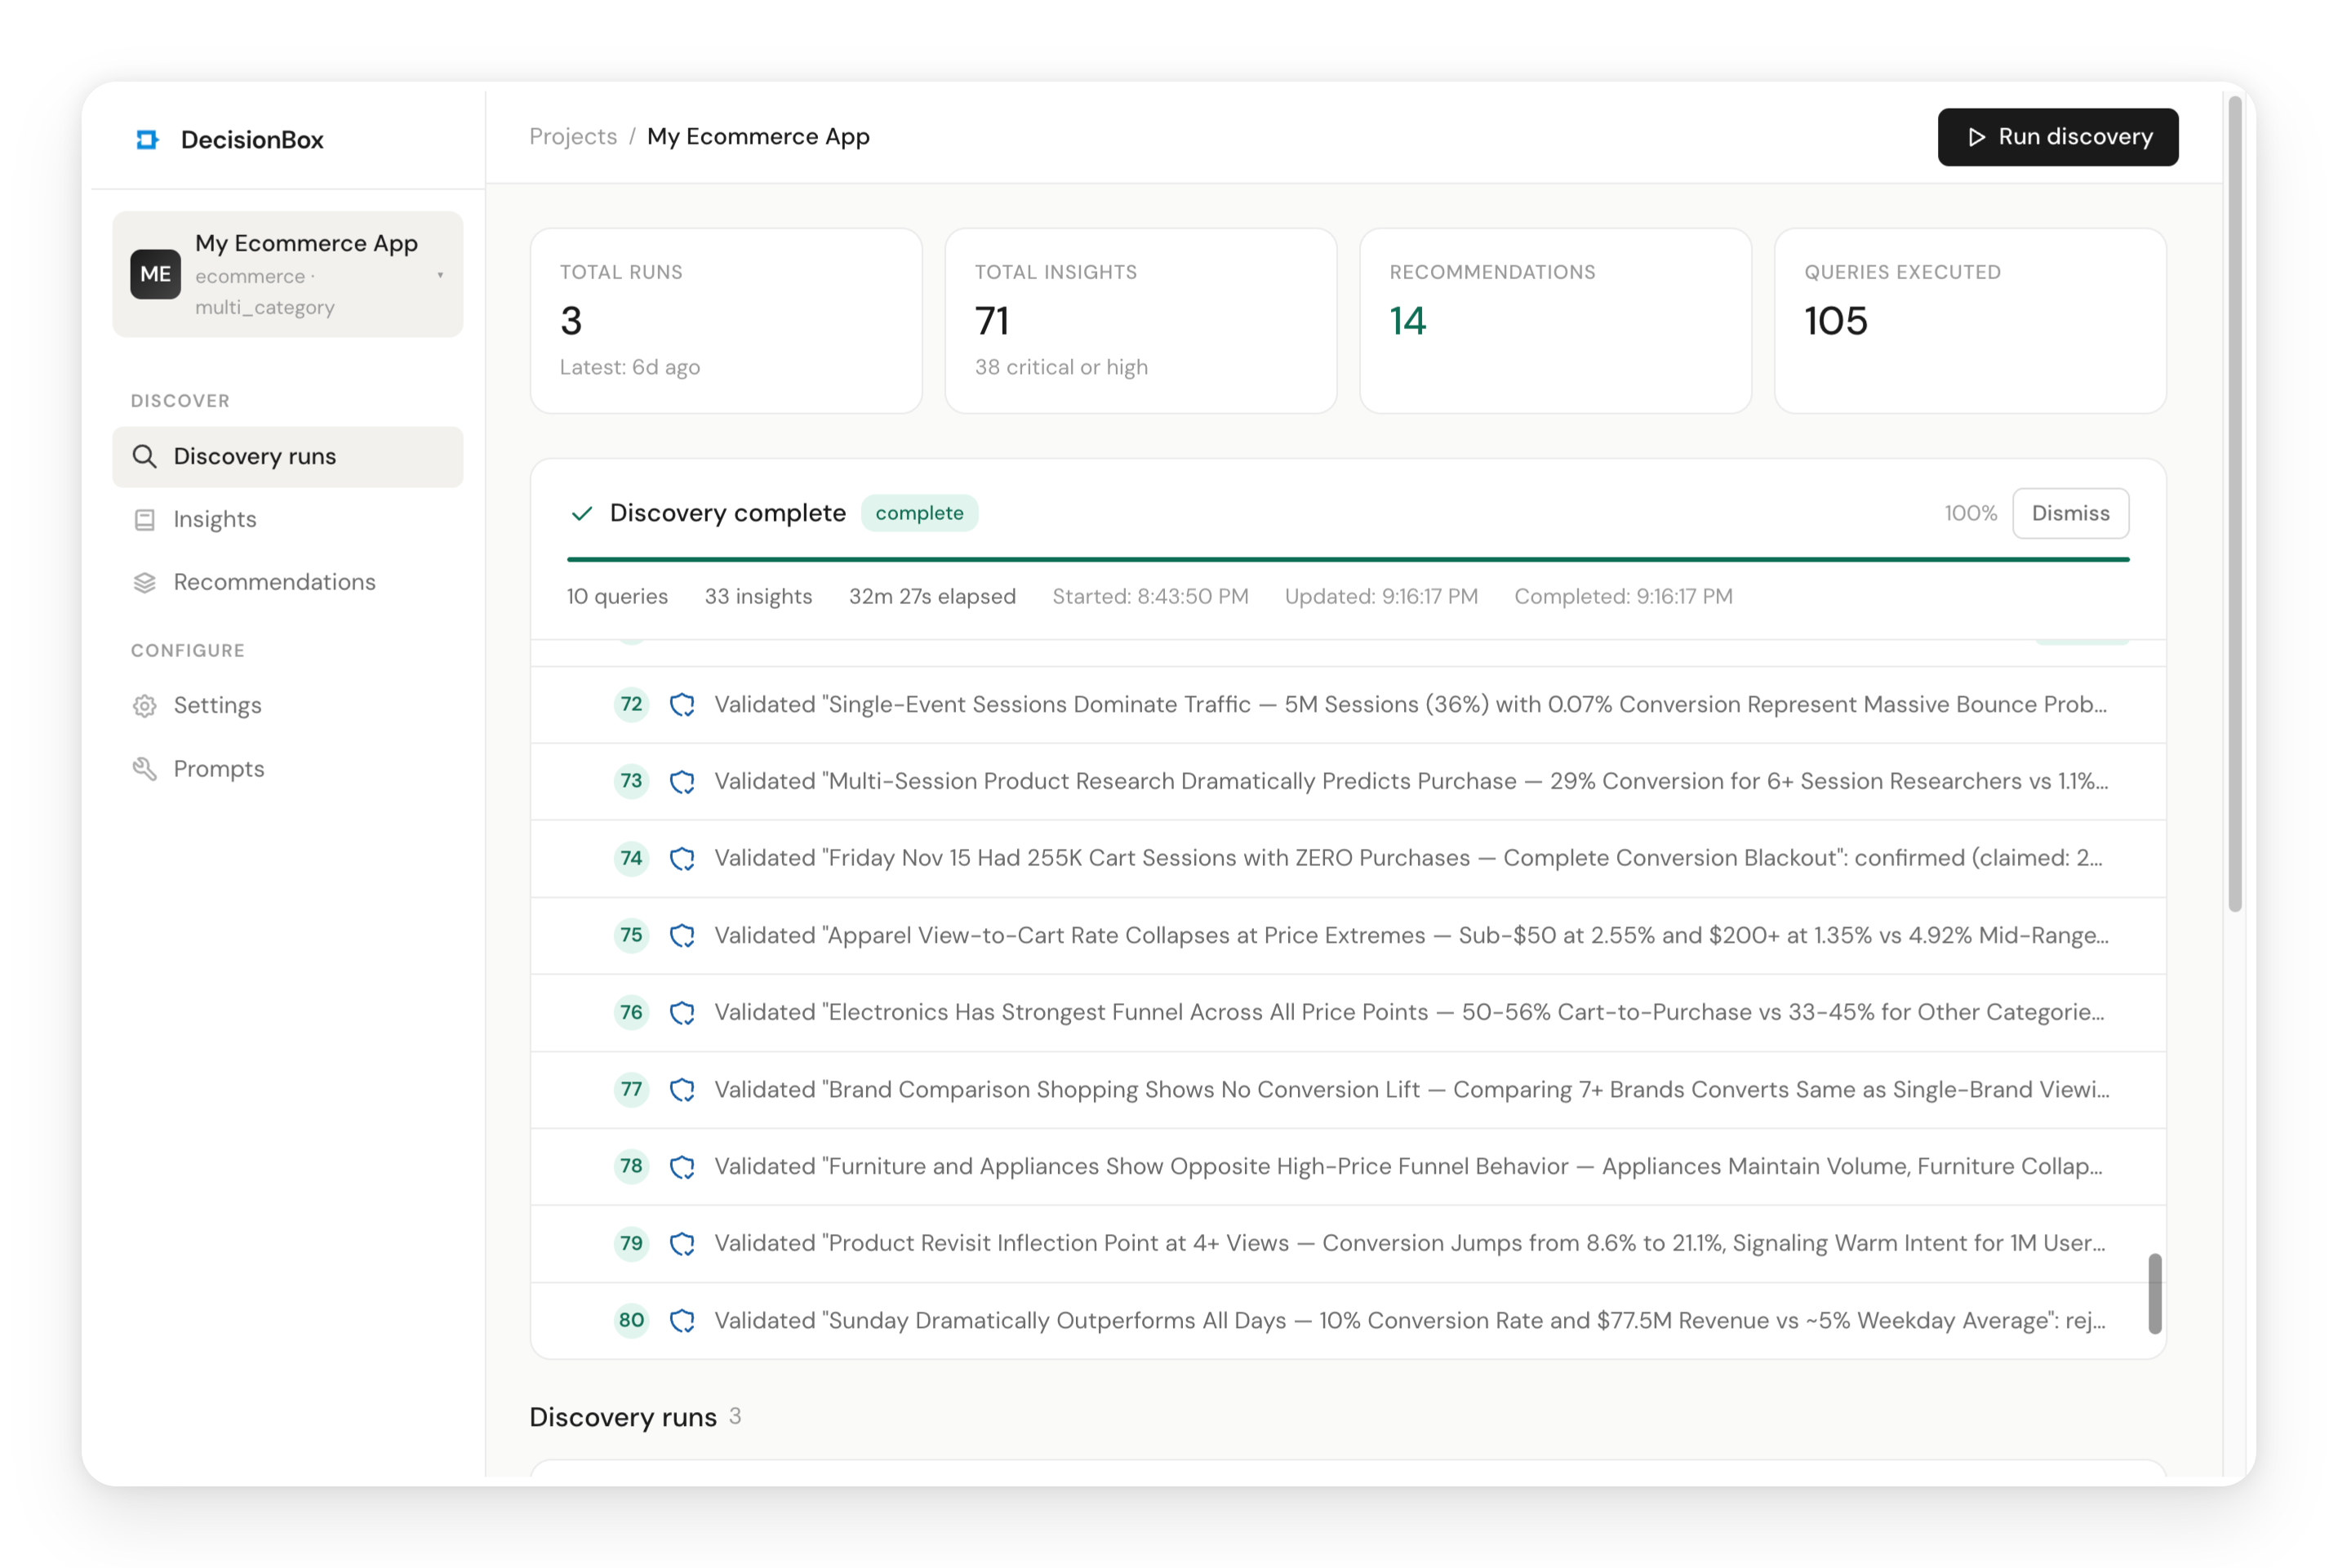
Even with just 10 exploration steps, our run took about 30 minutes and produced 33 insights and 6 recommendations. Most of that time is the agent waiting for Redshift query results — the AI reasoning itself is fast. Increasing the step count lets the agent dig deeper, but even a short run surfaces meaningful patterns.
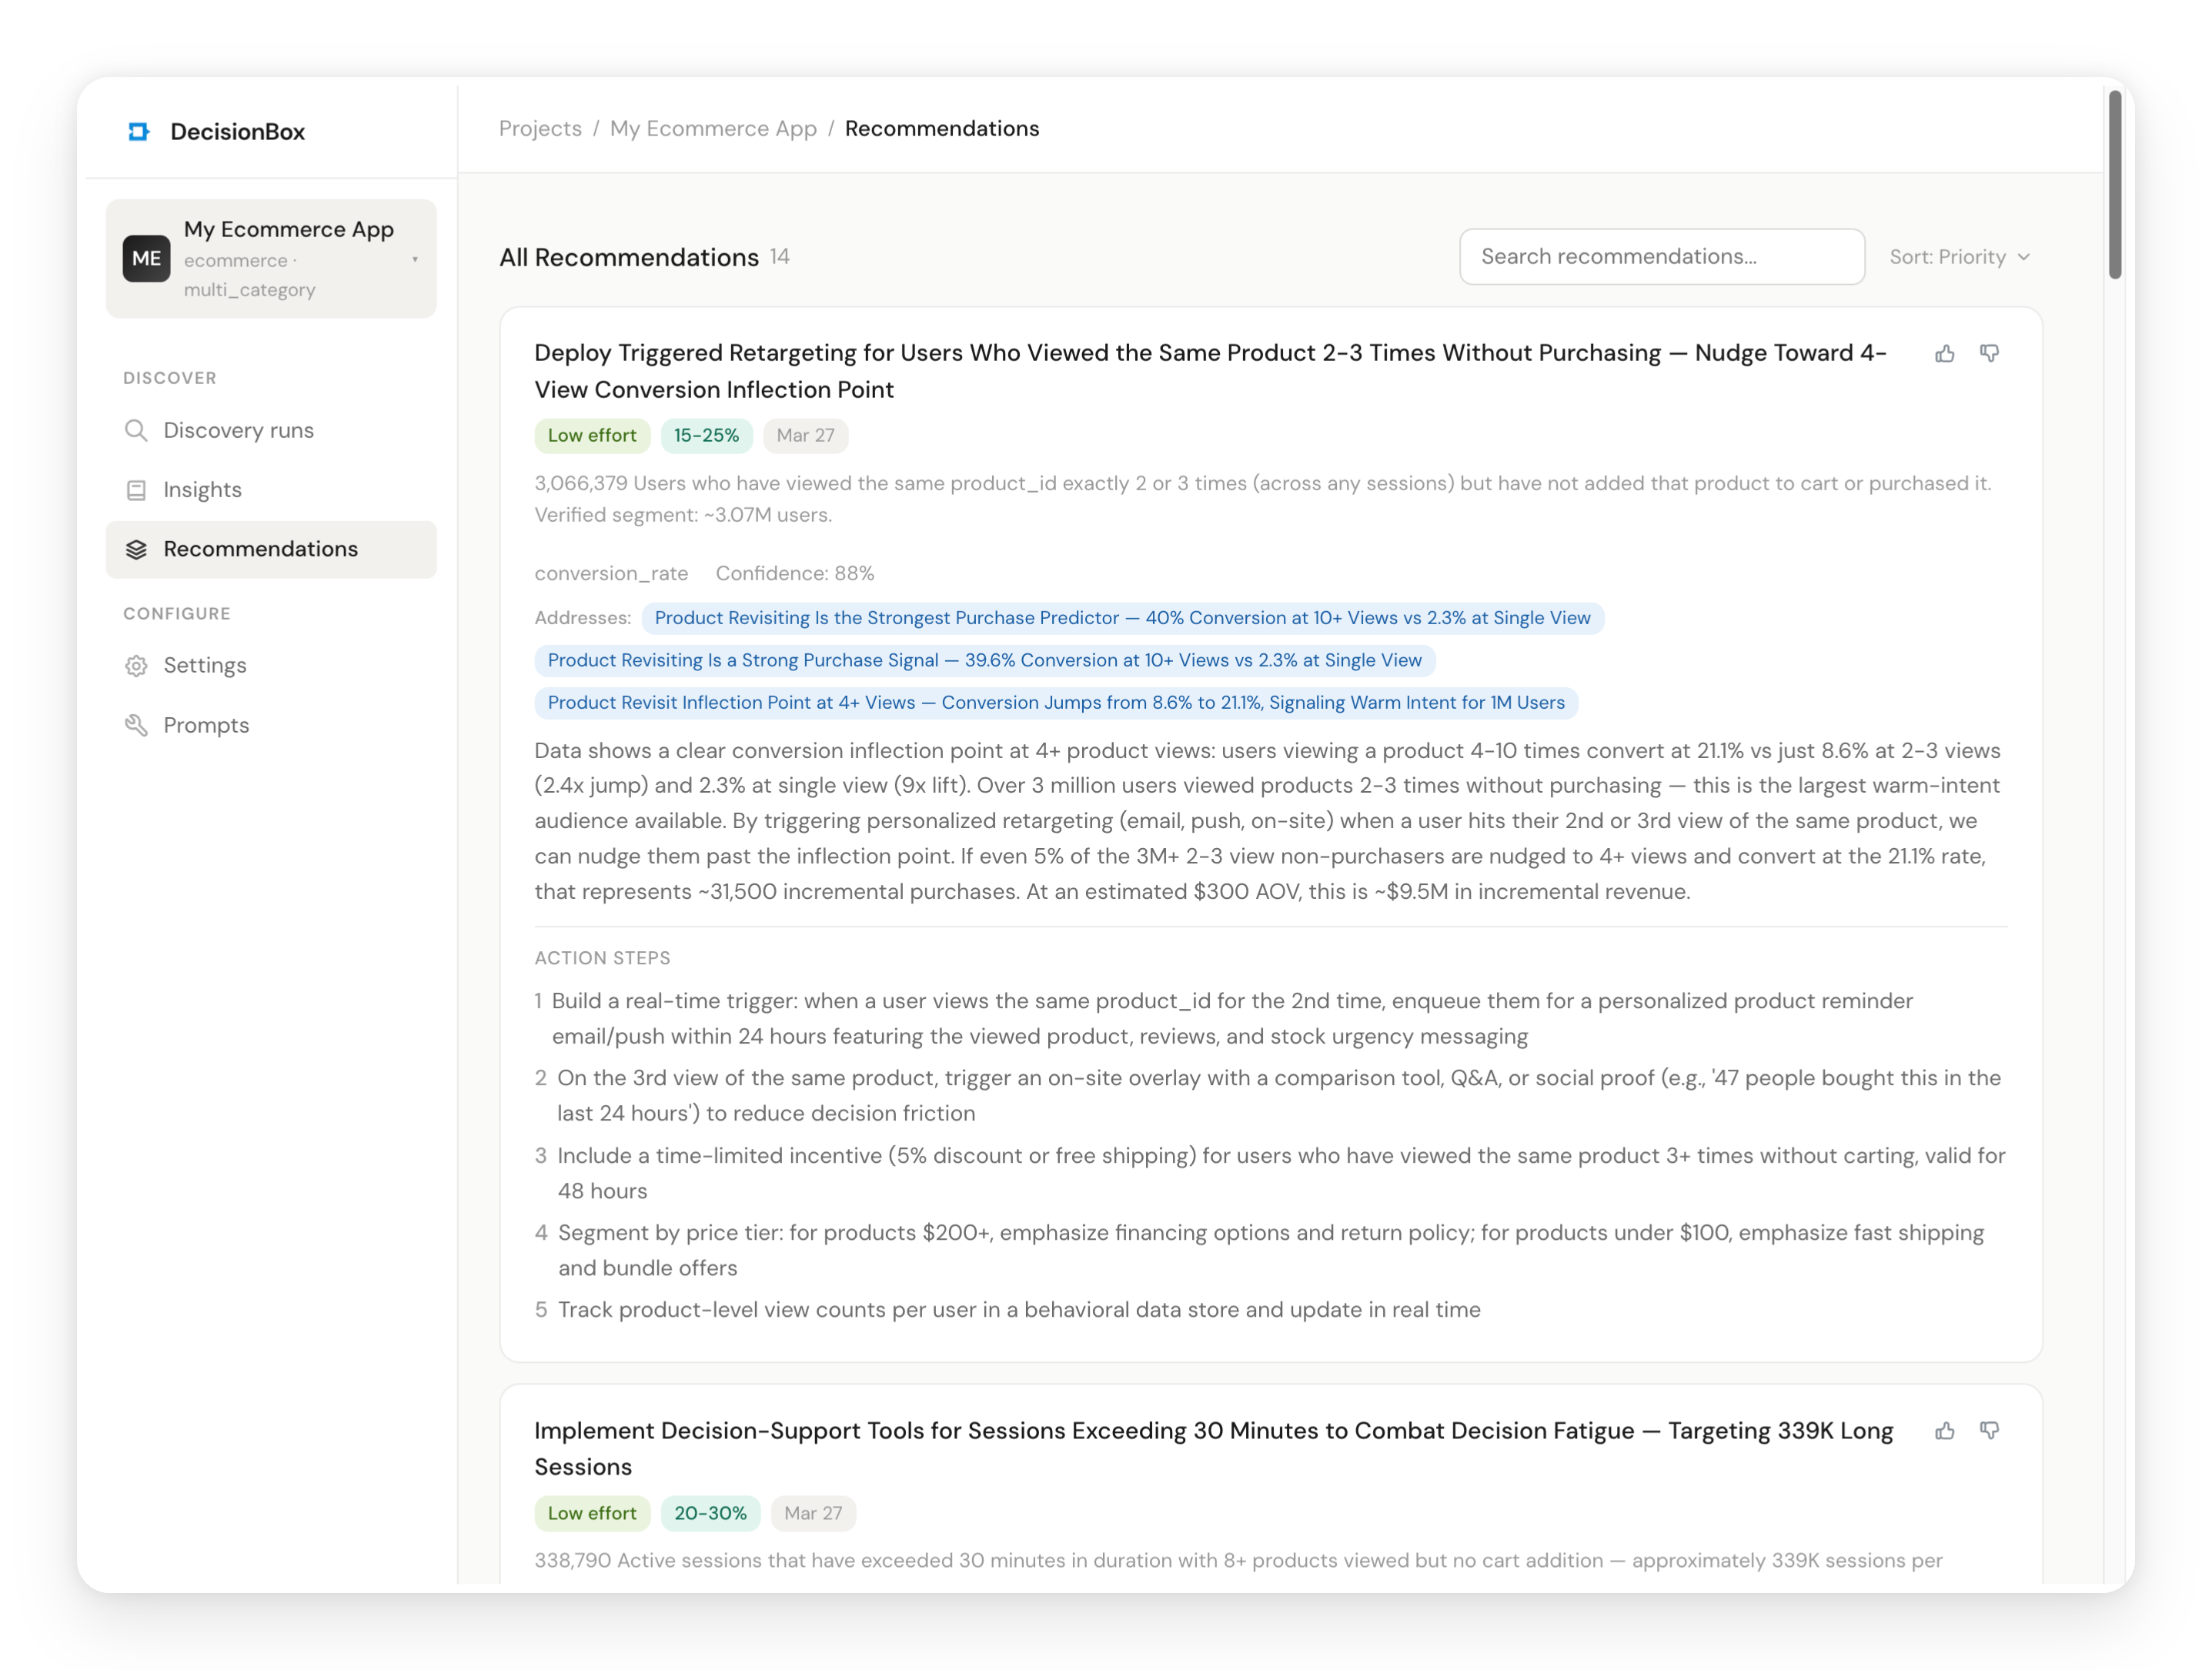
Step 6: Explore the Results
Once the run completes, navigate to Insights and Recommendations in the sidebar to explore what the agent found.
Insights
Insights are the discovered patterns — the agent's answer to "what's going on in this data?" Each insight belongs to one of the five analysis areas and includes:
- Severity (critical / high / medium / low) — how urgent this is
- Affected Count — how many unique customers are impacted
- Confidence — how statistically reliable the observation is (0-100%)
- Validation Status — whether the numbers were independently confirmed
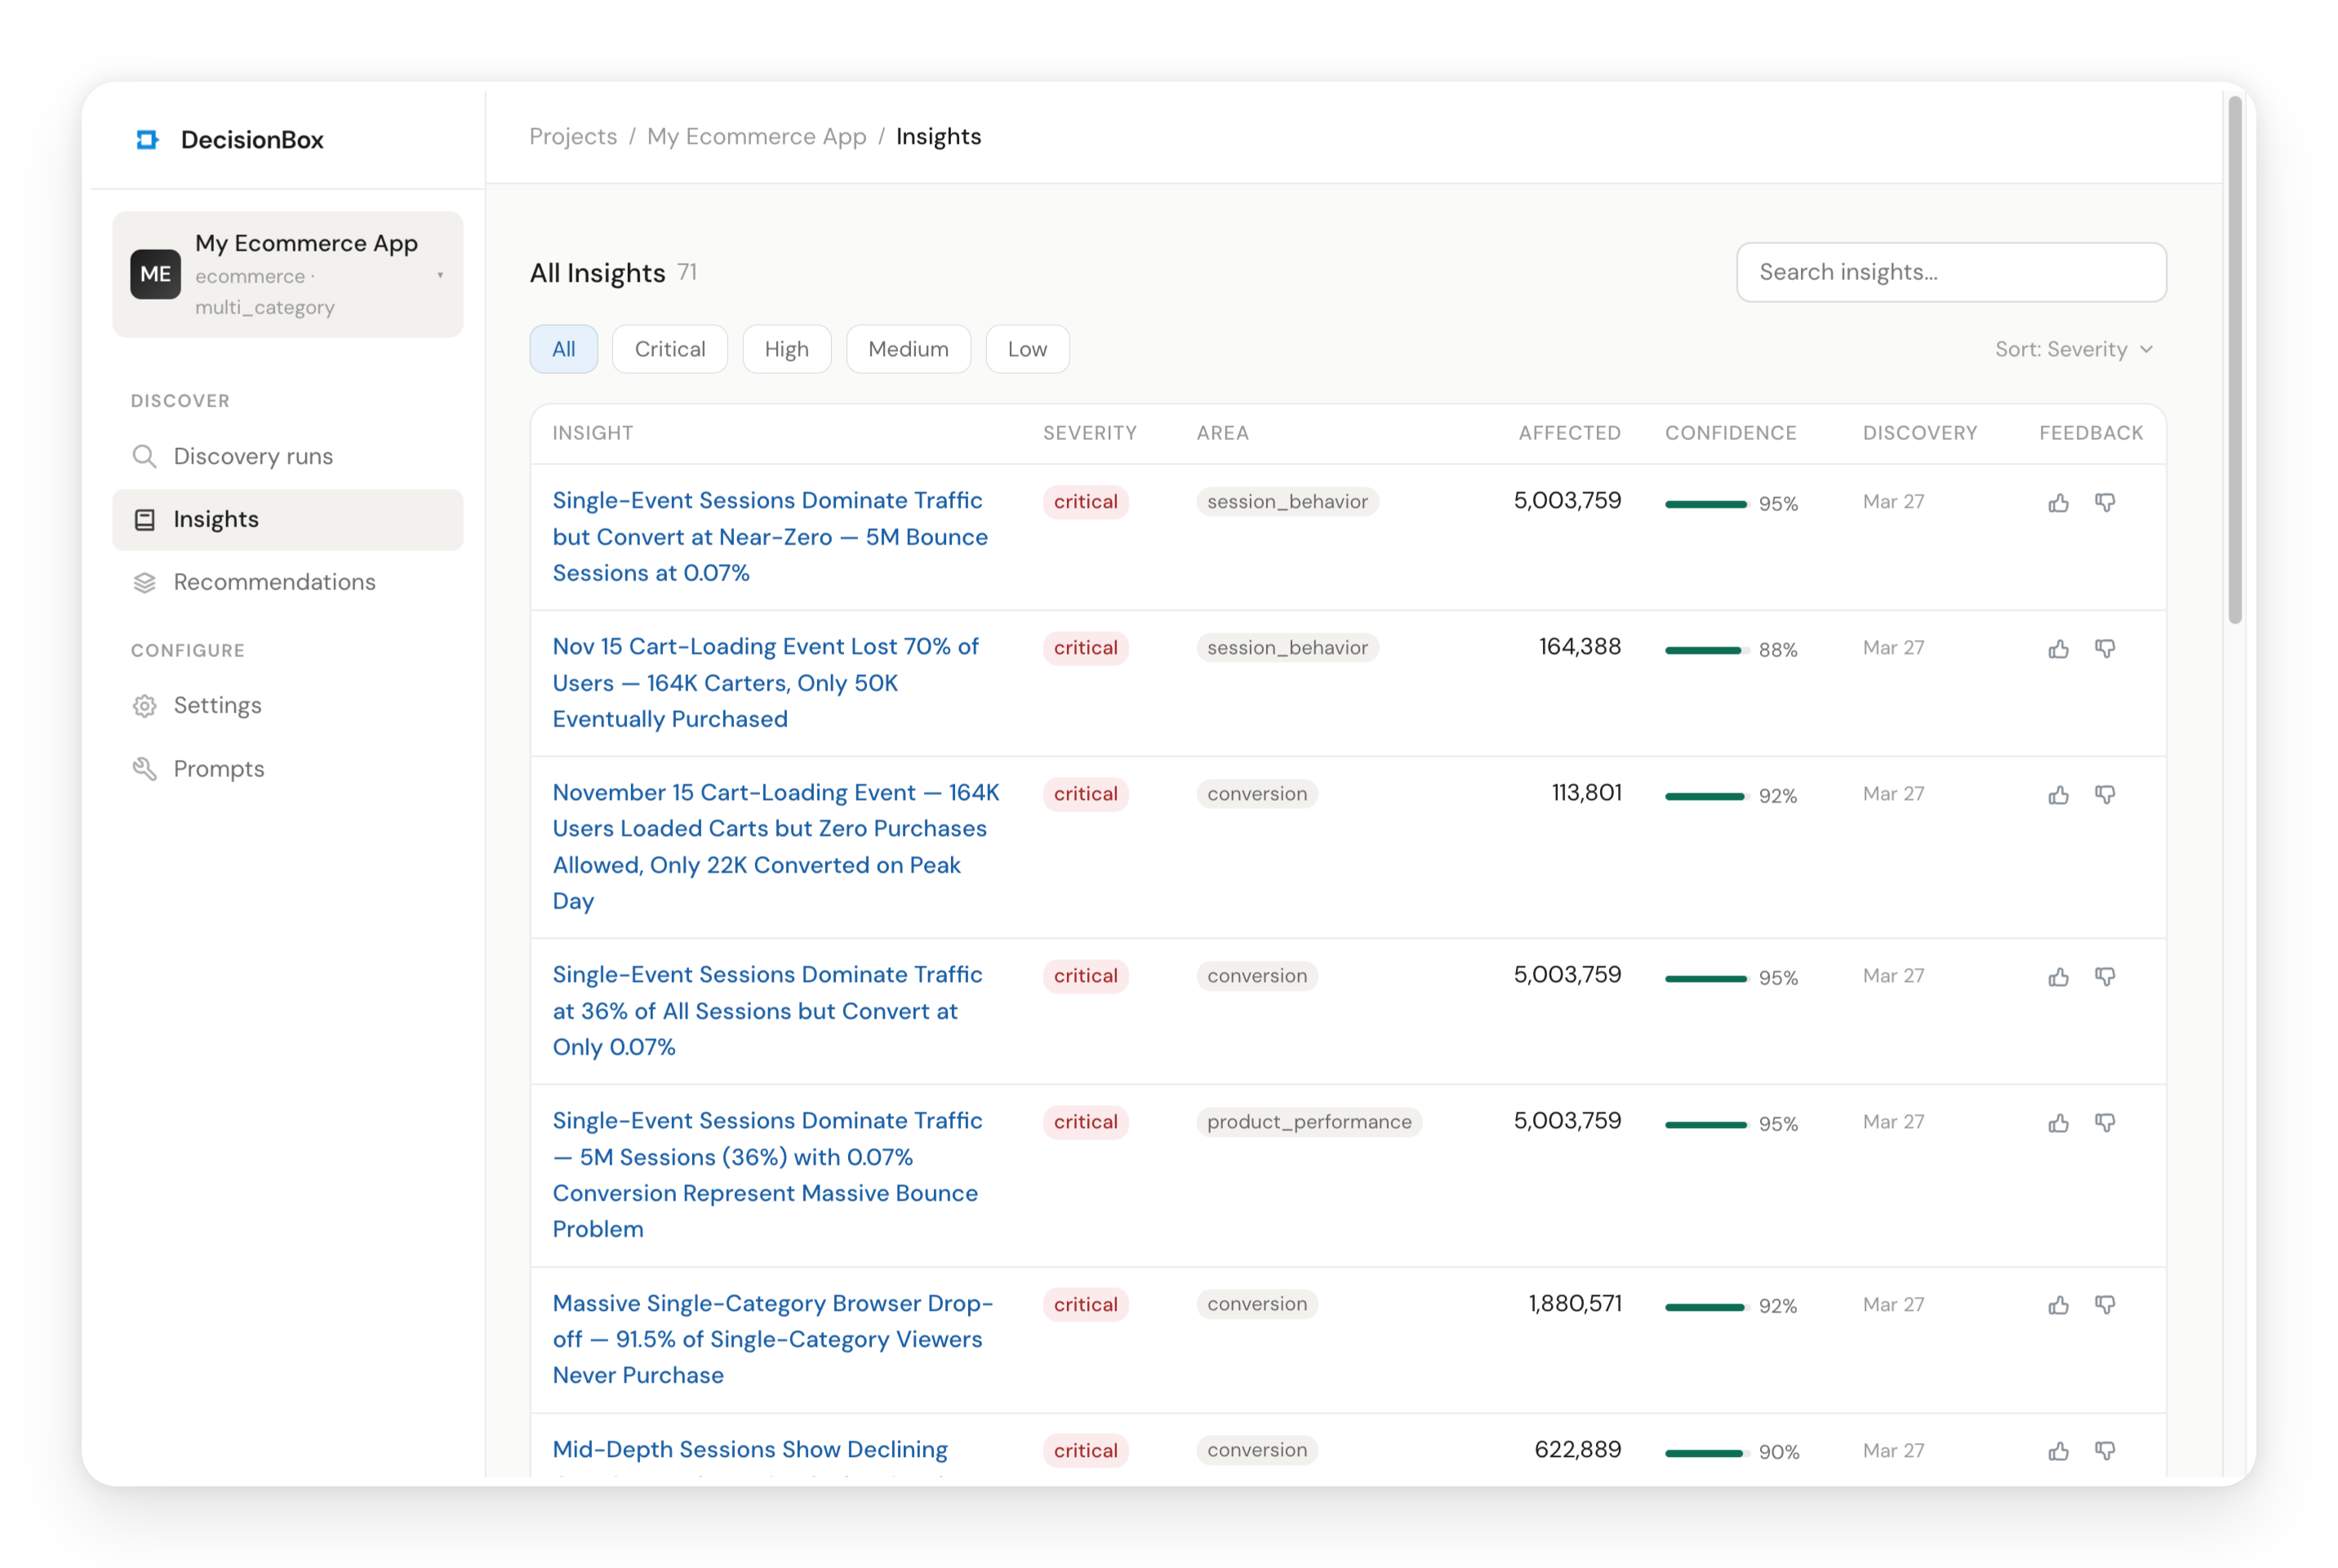
Click on any insight to see the full detail. Each insight page includes a description with exact numbers, key indicators, a metrics table, an assessment section with risk score and confidence, validation results showing claimed vs. verified counts, and — at the bottom — a "How This Insight Was Found" section that shows the exact source queries the AI used, complete with the agent's reasoning and the SQL it wrote.
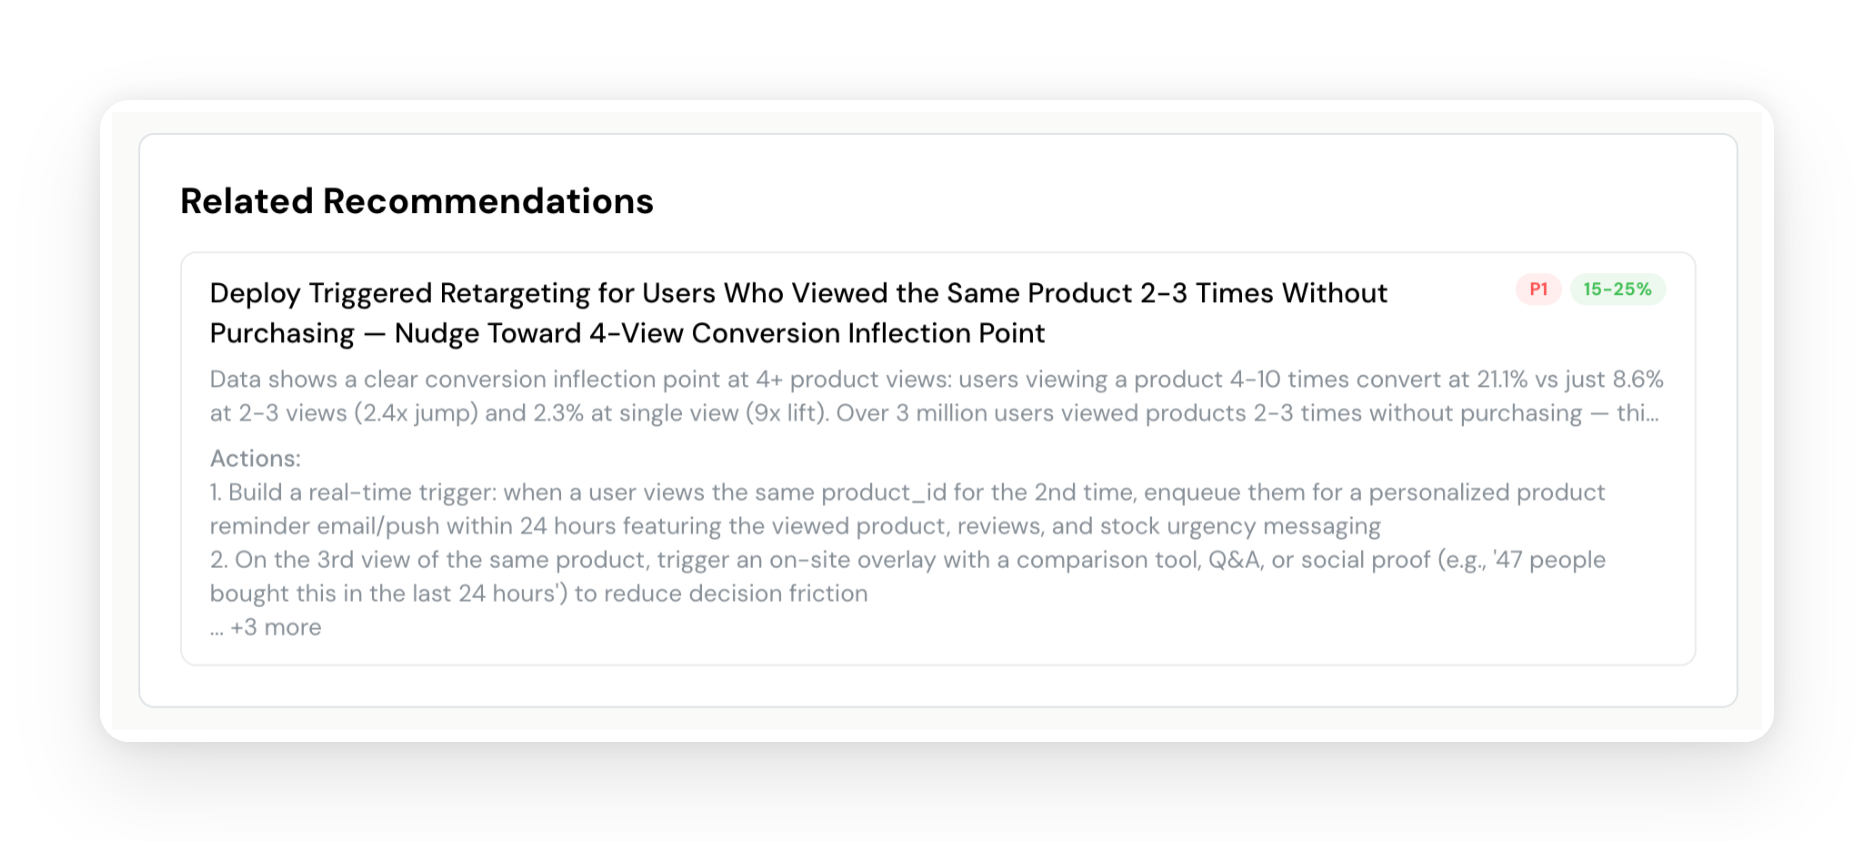
Recommendations
While insights tell you what's happening, recommendations tell you what to do about it. The agent synthesizes insights across all areas and produces specific, actionable recommendations with:
- Priority (P1-P4) — what to address first
- Expected Impact — quantified improvement estimate with reasoning
- Implementation Steps — numbered steps specific enough for a product team to execute
- Related Insights — which discovered patterns this recommendation addresses
Full Audit Trail
DecisionBox is designed to be fully transparent. There's no separate "transparency" tab because transparency is woven throughout the product:
- The Discovery runs page shows a live, step-by-step log of every action the agent took — what it was thinking, what SQL it wrote, what results it got, and whether queries were auto-fixed
- Each Insight includes a "How This Insight Was Found" section with the exact source queries and reasoning
- Validation results show claimed vs. verified counts for every insight, with the status clearly marked (confirmed, adjusted, or rejected)
Your data team can trace any finding from recommendation back to insight, back to the SQL queries that produced the data. Nothing is a black box.
Feedback
Found an insight that's particularly valuable? Click the thumbs up. See something off? Thumbs down. This feedback trains the agent for subsequent runs — it will avoid repeating disliked patterns and continue monitoring liked ones. Each discovery run builds on the last.
Key Concepts at a Glance
This tutorial introduced several DecisionBox concepts. Here's a quick reference:
| Concept | What It Means |
|---|---|
| Project | A connection to your data warehouse + AI provider + domain pack. One project per dataset or product you're analyzing. |
| Domain Pack | Industry-specific intelligence module. Defines what to look for, how to prompt the AI, and what profile context to collect. E-commerce, Gaming, and Social are available today. |
| Category | A specialization within a domain. E-commerce → Multi-Category Store. Gaming → Match-3. Each adds category-specific analysis areas. |
| Analysis Area | A specific dimension the AI investigates (e.g., Conversion Funnel, Customer Retention). Each area has its own prompts and keywords. |
| Discovery Run | A single end-to-end execution: schema discovery → exploration → analysis → validation → recommendations. |
| Insight | A discovered pattern with severity, affected count, confidence, and validation status. Answers "what's happening?" |
| Recommendation | An actionable response to one or more insights. Answers "what should we do about it?" |
| Exploration | The autonomous phase where the AI writes and executes SQL queries, iterating based on results. |
| Validation | Two independent passes that verify insight accuracy against actual warehouse data. |
| Profile | Optional business context (store type, KPIs, product categories) that helps the AI tailor its analysis. |
What Just Happened
Let's step back and look at what we did. We pointed DecisionBox at a dataset it had never seen before — 109 million raw e-commerce events with no documentation, no data dictionary, no context. The AI agent figured out the schema on its own, explored the data systematically across five analysis areas, discovered specific patterns with exact numbers, validated every finding against the actual data, and produced prioritized recommendations with implementation steps.
With just 10 exploration steps, the discovery took about 30 minutes and produced 33 insights and 6 recommendations — fully autonomous, no human input after clicking "Start." The equivalent manual process — an analyst writing queries, iterating, validating, synthesizing findings into a report — would take days to weeks.
And this was a first run. Subsequent runs build on previous context. The agent learns what it already found, avoids repeating itself, respects your feedback, and focuses on new patterns. Each discovery compounds.
Try It Yourself
DecisionBox is open source under AGPL v3.
- GitHub: github.com/decisionbox-io/decisionbox-platform
- Documentation: decisionbox.io/docs
- Website: decisionbox.io
Clone it, docker compose up -d, and run your first discovery. Questions, feedback, or issues? Open a GitHub Discussion or file an issue — we'd love to hear what you discover.